Stay updated with the latest analysis on Brent Crude Oil price. Explore recent price actions, technical indicators, chart patterns, and market trends to make informed trading decisions. Get insights into factors influencing oil prices and predictions for future movements.

Brent Crude Oil is one of the most important commodities in the global energy market, serving as a key benchmark for oil prices worldwide. Extracted from the North Sea, Brent Crude is renowned for its high quality and low sulphur content, making it a preferred choice for refining into gasoline, diesel, and other petroleum products.
Understanding the dynamics of Brent Crude Oil price is crucial for investors, traders, policymakers, and businesses, as these prices influence economic stability, inflation rates, and energy costs globally. Factors such as supply and demand, geopolitical tensions, economic indicators, and market speculation play significant roles in shaping the price movements of Brent Crude.
In this comprehensive analysis, we will explore the recent price action of Brent Crude Oil Price, focusing on technical indicators, chart patterns, support and resistance levels, and market sentiment. By delving into these elements, we aim to provide a detailed understanding of the current state of the Brent Crude Oil price market and its future outlook. This analysis will be valuable for those looking to make informed decisions in the complex and ever-changing landscape of global oil trading.
Table of Contents

Supply and Demand Dynamics:
When the demand for oil increases or the supply decreases, prices tend to rise. This can be due to economic growth, seasonal changes, or geopolitical events affecting production.
Geopolitical Tensions:
Conflicts or political instability in key oil-producing regions, such as the Middle East, can disrupt supply and lead to higher prices. Recent examples include tensions in the Strait of Hormuz, which is a critical chokepoint for oil transportation.
OPEC+ Decisions:
The Organization of the Petroleum Exporting Countries (OPEC) and its allies, known as OPEC+, play a significant role in oil prices. Decisions to cut or increase production can significantly impact the global oil supply, thereby affecting prices. For instance, an agreement to cut production to reduce excess supply can lead to higher prices.
Economic Indicators:
Strong economic data from major economies (like the U.S., China, and the EU) often suggest higher future demand for oil, which can drive prices up. Conversely, economic slowdowns can depress prices.
Market Speculation:
Traders and investors in oil futures markets often react to news and data, driving prices up or down based on expected future supply and demand conditions.
Currency Fluctuations:
Oil is traded globally in U.S. dollars. When the dollar weakens, oil becomes cheaper in other currencies, potentially boosting demand and raising prices. Conversely, a strong dollar can suppress oil prices.
Natural Disasters and Weather:
Events like hurricanes can disrupt oil production and refining operations, particularly in key areas like the Gulf of Mexico, leading to temporary supply shortages and price spikes.
Technological and Regulatory Changes:
Advances in technology affecting oil extraction (like shale oil technology) or changes in regulations can impact supply levels. For example, stricter environmental regulations might limit production capabilities or increase production costs, influencing prices.
In recent times, specific events such as production cuts by OPEC+, recovery in global demand post-COVID-19 pandemic, and geopolitical tensions (e.g., conflicts involving major oil-producing nations) have contributed to rising Brent crude oil prices.
Technical Analysis of Brent Crude oil Price
Technical analysis of Brent Crude oil Price (As of 28th May) | |
Price action | Daily Candlestick |
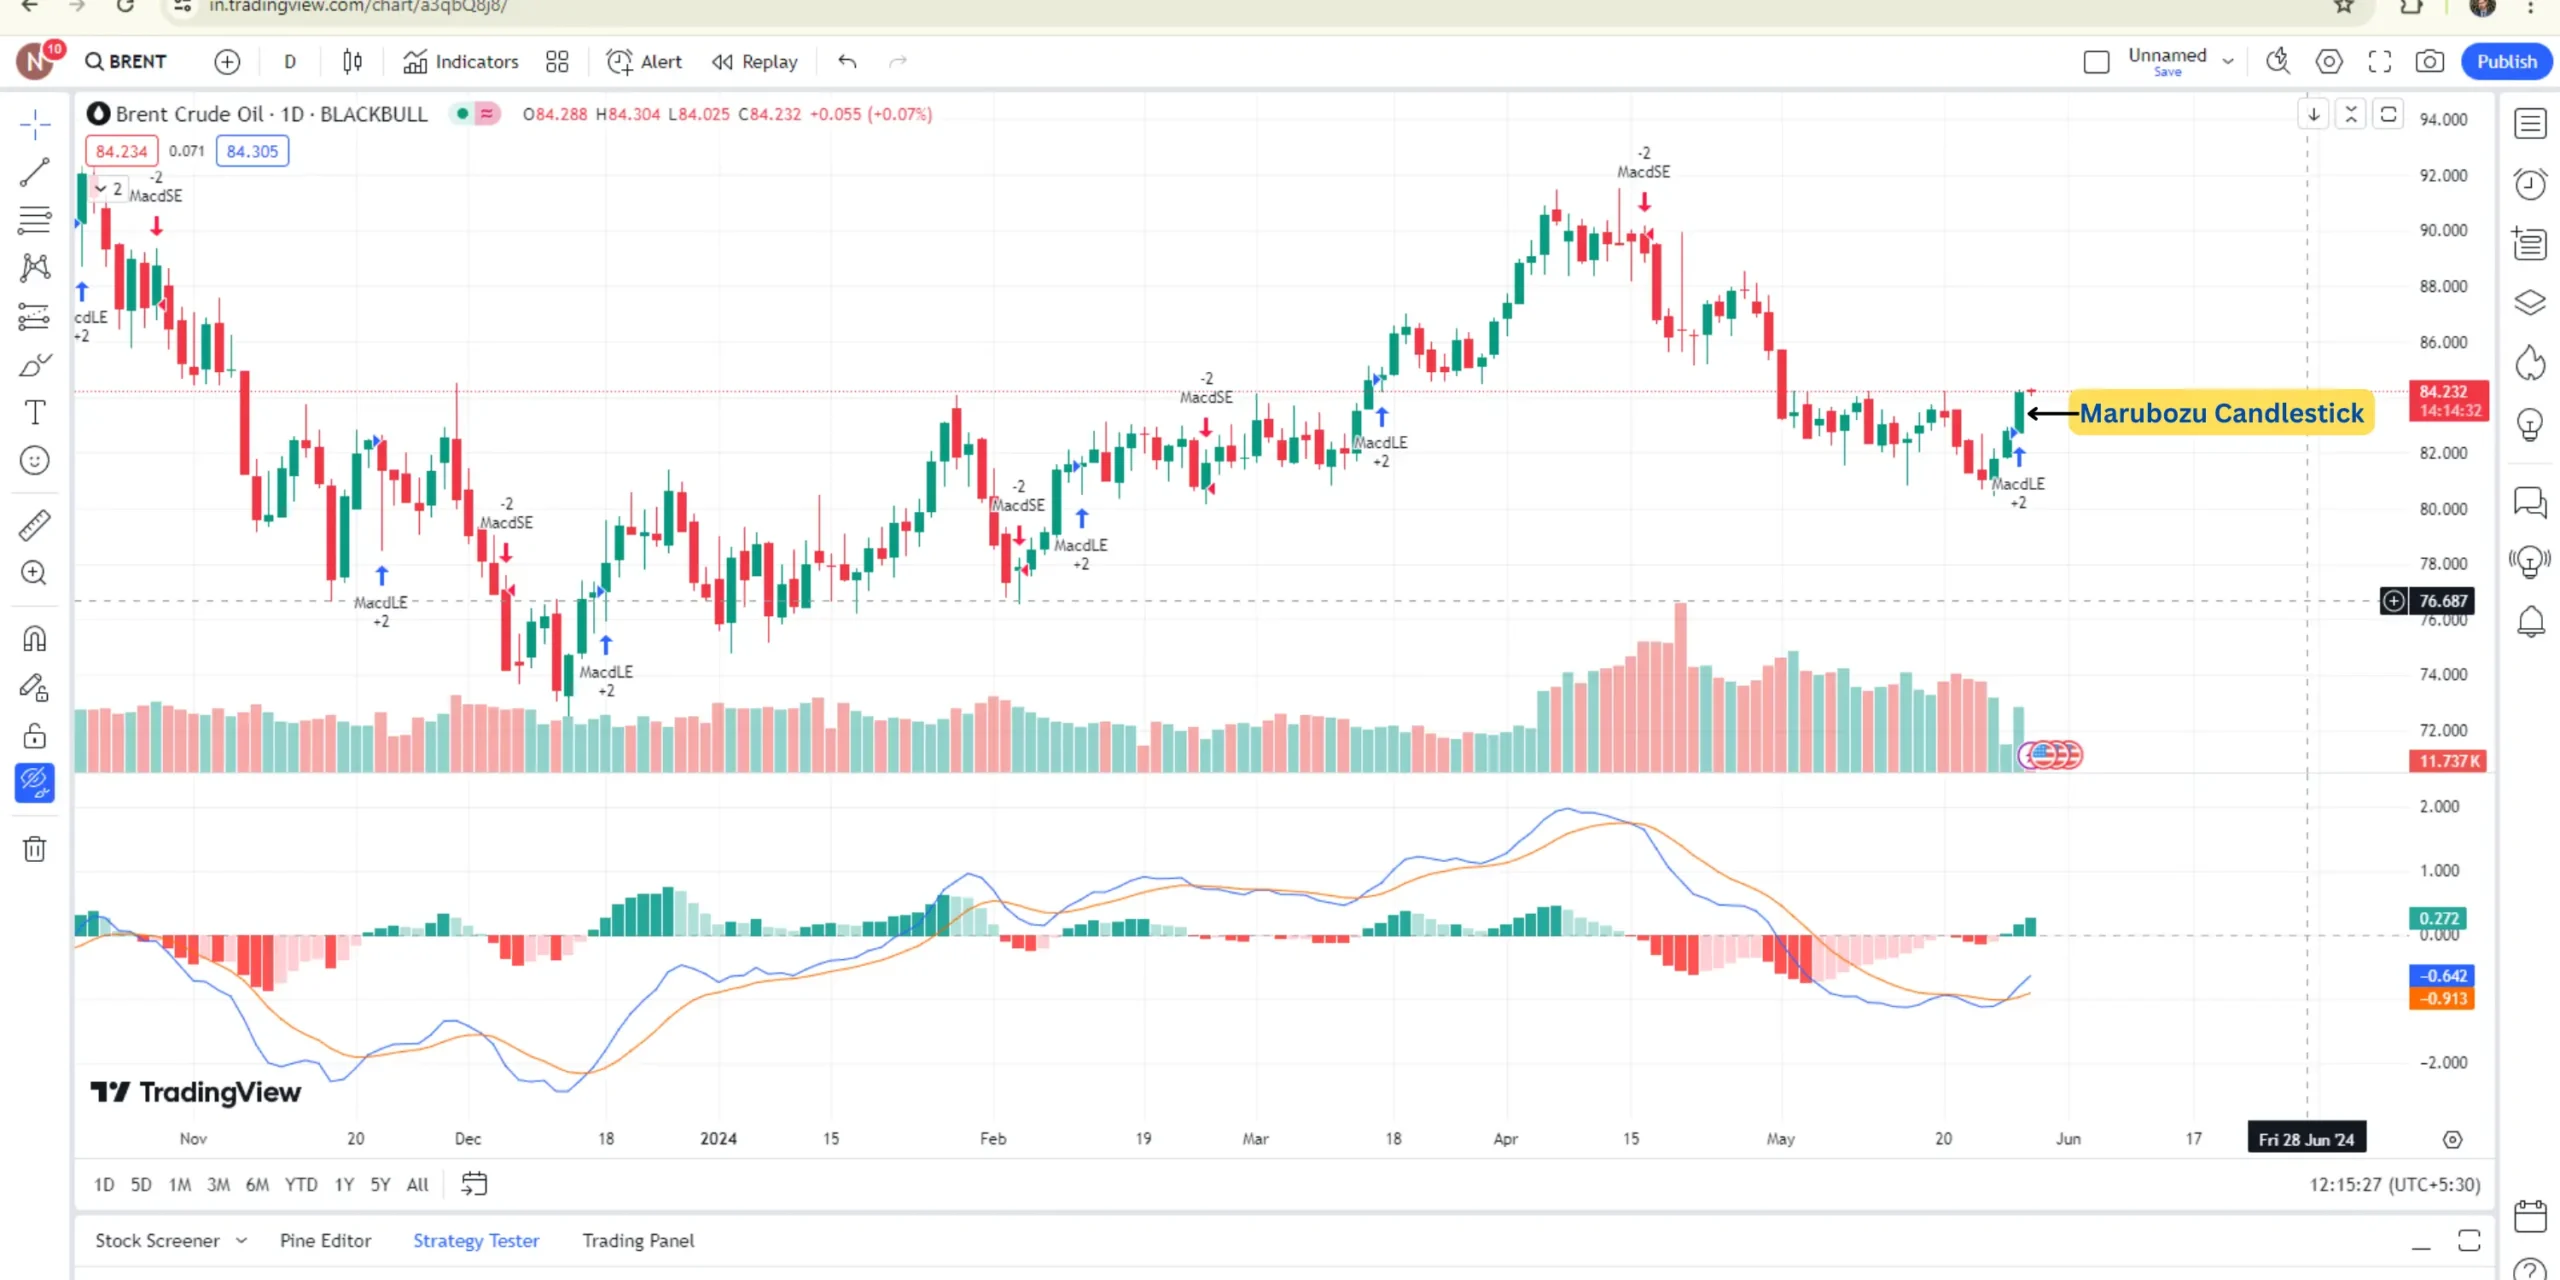
Candlestick | Bullish Marubozu Candlestick pattern |
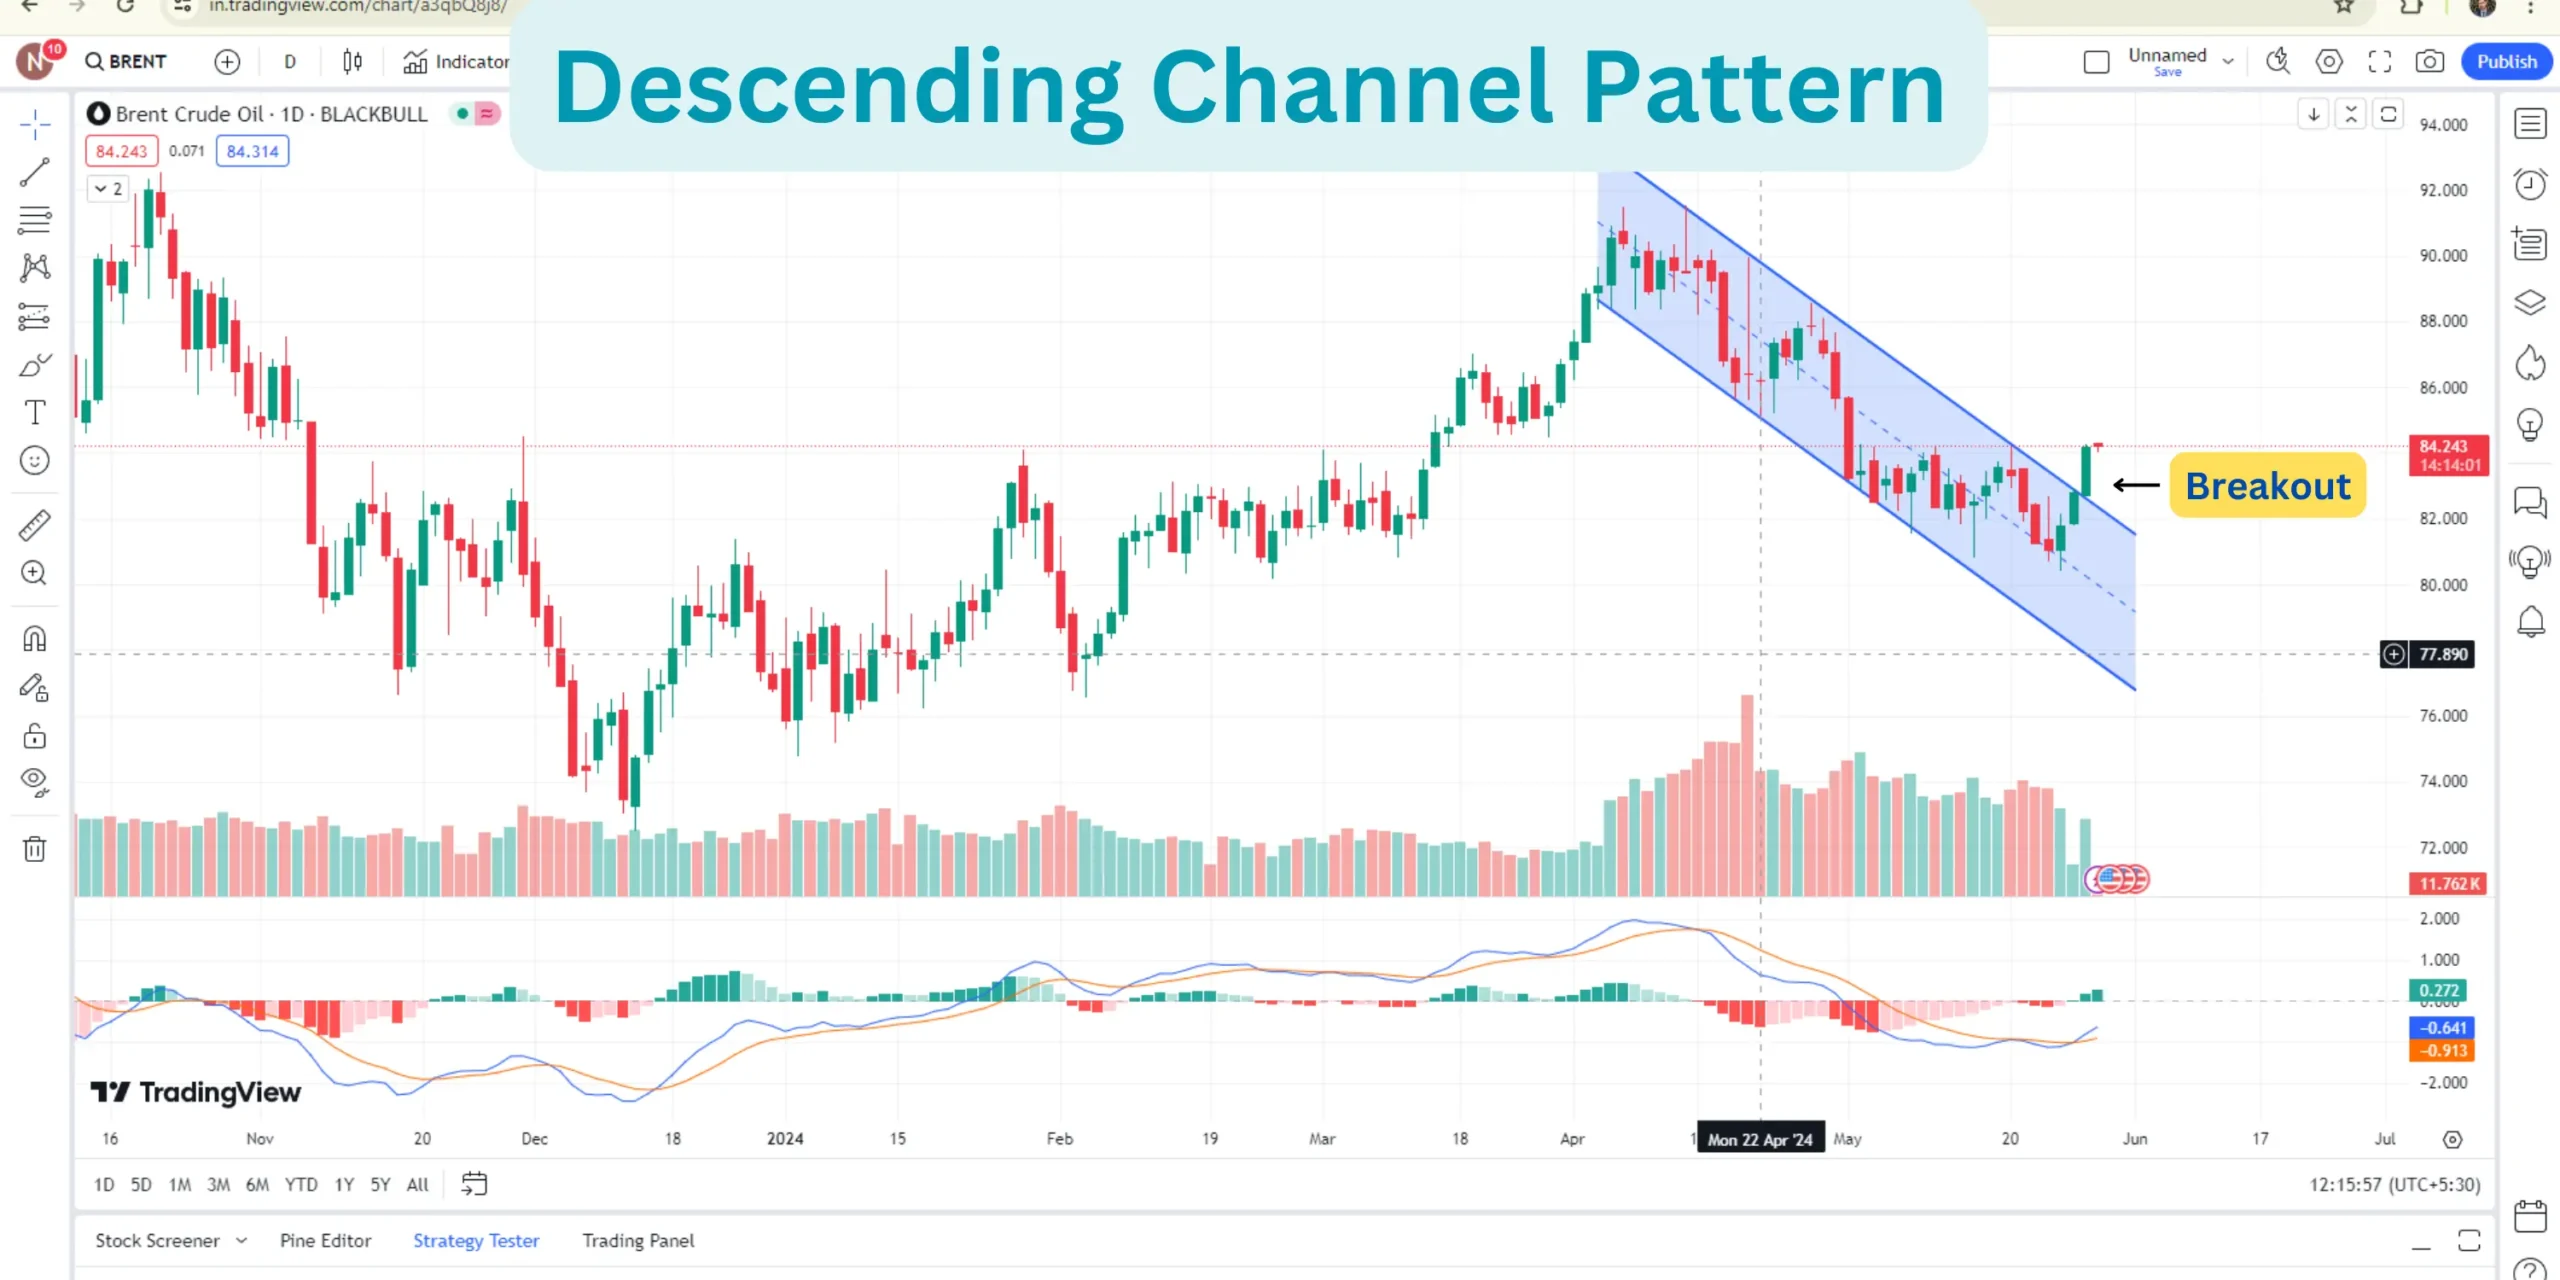
Chart Pattern | descending channel pattern
|
Price Support Level | $ 80- $ 82 is main support |
Price Level | Current Brent Crude oil Price is $ 84.177. $ 71.5 is 52 weeks low of Brent Crude oil Price. $ 95.96 is 52 weeks high of Brent Crude oil Price. |
MACD Strength | 0.981 |
Price Action
On 28th May, the price action for Brent Crude oil showcased significant bullish momentum. The daily candlestick for this date indicated a strong upward movement, reflecting increased buying interest and a shift in market sentiment.

Candlestick Pattern: Marubozu Candlestick
The daily candlestick pattern formed on this day is identified as a Bullish Marubozu Candlestick. This pattern is characterized by a candlestick with no shadows, indicating that the opening price was the lowest point and the closing price was the highest point of the day. The Marubozu Candlestick pattern broke decisively through the $83 level and closed above $84, signaling strong bullish sentiment and robust buying activity. The observed volume was decent, further confirming the strength of this bullish movement.
Chart Pattern: Descending Channel Pattern
Prior to the breakout, Brent Crude oil had been trading within a descending channel pattern. This pattern is typically bearish, indicating a series of lower highs and lower lows. The price of Brent Crude oil had fallen from $91.5 in February to its current levels, marking a nearly 12% decline over this period. However, on 28th May, Brent Crude oil decisively broke through the resistance of this descending channel pattern. This breakout suggests a potential reversal in the trend, indicating that the downward momentum has been exhausted and the price may now be set to increase.
Price Support Level
The main support level for Brent Crude oil is identified in the range of $80 to $82. This support zone is crucial for both short-term and medium-term trading. If the price were to fall back, this level would likely act as a strong floor, preventing further declines and offering buying opportunities for traders.
Price Level
As of 28th May, the current price of Brent Crude oil is $84.177. Over the past 52 weeks, the price has fluctuated between a low of $71.5 and a high of $95.96. The current price near $84 indicates that Brent Crude oil is trading closer to its mid-range for the year, with potential room to move towards the higher end of the range given the recent bullish breakout.

MACD Strength
The Moving Average Convergence Divergence (MACD) indicator for Brent Crude oil is showing positive signs. The MACD value on 28th May is 0.981, indicating bullish momentum. Additionally, on 27th May, there was a bullish crossover observed between the MACD line and the Signal line. This crossover is a strong buy signal, suggesting that the recent price movements have gained strength and the bullish trend is likely to continue. The MACD histogram, which measures the distance between the MACD line and the Signal line, is also showing strength on the buying side. This further reinforces the expectation that Brent Crude oil prices will increase in the coming days.
Conclusion
The analysis of the Brent Crude oil price data as of 28th May presents a strong bullish outlook. The key takeaways are:
Price Action: Significant upward movement with a bullish daily candlestick.
Candlestick Pattern: Formation of a Bullish Marubozu Candlestick, breaking above $83 and closing above $84 with decent volume.
Chart Pattern: A breakout from the descending channel pattern, indicating a potential reversal and upward trend.
Support Levels: Strong support observed in the $80-$82 range.
Current Price Levels: Trading at $84.177, with a 52-week range of $71.5 to $95.96.
MACD Strength: Positive MACD value and a bullish crossover indicate strong buying momentum and an expected price increase.
Overall, the data suggests that Brent Crude oil is experiencing a bullish phase, with technical indicators and patterns supporting a potential upward trend in the near term. Traders and investors should watch for sustained movements above the key resistance levels and monitor the support zones to gauge the strength of this emerging bullish trend.
FAQs
- What is Brent Crude Oil?
Brent Crude Oil is a major classification of crude oil that serves as a benchmark price for purchases of oil worldwide. It is extracted from the North Sea and is known for its high quality and low sulfur content, making it a preferred choice for refining into gasoline and other products.
- What factors influence Brent Crude Oil prices?
Brent Crude Oil prices are influenced by a variety of factors including:
Supply and Demand Dynamics: Changes in production levels and global consumption rates.
Geopolitical Events: Conflicts, political instability, and other events in oil-producing regions.
OPEC+ Decisions: Production targets set by the Organization of the Petroleum Exporting Countries and its allies.
Economic Indicators: Economic growth or recession indicators in major economies.
Market Speculation: Actions by traders and investors based on future expectations.
Currency Fluctuations: Strength of the U.S. dollar relative to other currencies.
Natural Disasters and Weather: Events affecting production and transportation infrastructure.
- What is a Bullish Marubozu Candlestick?
A Bullish Marubozu Candlestick is a strong indicator of bullish sentiment in the market. It is a candlestick with no shadows, meaning the price opened at its lowest point and closed at its highest point for the day. This pattern signifies strong buying interest and is often used to predict further price increases.
- What is a descending channel pattern?
A descending channel pattern is a technical analysis chart pattern that shows a downward trend with parallel lines representing resistance and support levels. The price moves within this channel, making lower highs and lower lows. A breakout above the resistance line indicates a potential reversal to an upward trend.
- What are the current support and resistance levels for Brent Crude Oil?
As of 28th May, the main support level for Brent Crude Oil is between $80 and $82. This range is crucial for preventing further declines. The price recently broke above the resistance level of the descending channel pattern and closed at $84.177.
- What is the significance of the MACD indicator?
The MACD (Moving Average Convergence Divergence) is a momentum indicator that shows the relationship between two moving averages of a security’s price. A bullish crossover, where the MACD line crosses above the Signal line, is a strong buy signal. As of 28th May, the MACD value of 0.981 and the recent bullish crossover suggest an increasing buying momentum for Brent Crude Oil.
- What does it mean when Brent Crude Oil price breaks out of a descending channel?
When the Brent Crude Oil price breaks out of a descending channel, it typically indicates a reversal of the previous downward trend. This breakout suggests that the downward momentum has weakened and a new upward trend is likely to begin.
- What are the recent price movements of Brent Crude Oil?
Brent Crude Oil has recently shown a strong upward movement, breaking decisively above the $83 level and closing at $84.177 on 28th May. This follows a nearly 12% decline from a high of $91.5 in February.
- What is the 52-week high and low for Brent Crude Oil?
The 52-week range for Brent Crude Oil is a low of $71.5 and a high of $95.96. As of 28th May, the price is closer to the mid-range at $84.177, indicating potential for upward movement towards the higher end of the range.
- Where can I get the latest updates on Brent Crude Oil prices?
You can get the latest updates on Brent Crude Oil prices and market analysis from reputable financial news websites, market analysis platforms, and industry reports.
- How can I use technical analysis to predict Brent Crude Oil prices?
Technical analysis involves using chart patterns, indicators like MACD, support and resistance levels, and candlestick patterns to predict future price movements. Observing these elements can help traders make informed decisions based on historical price action and trends.

