Explore the investment potential of Finolex Cable with a detailed analysis of its fundamentals, subsidiaries, shareholding pattern, and technical indicators. Discover why investors are considering Finolex Cable for long-term growth opportunities.
When it comes to investing in the stock market, it’s crucial to choose companies with a strong track record, solid fundamentals, and growth potential. One such company that has captured the attention of investors is Finolex Cable. Listed on the National Stock Exchange (NSE) of India, Finolex Cable has established itself as a prominent player in the electrical industry. Let’s delve deeper into what makes Finolex Cable an attractive investment opportunity.
About Finolex Cable
Finolex cables is the largest manufacturer of electrical and telecommunication cables, ounded in 1958. The company’s product portfolio includes a wide range of cables catering to diverse applications across industries. With a focus on innovation, quality, and customer satisfaction, Finolex Cable has earned a reputation for excellence in the market.
In 2007, Finolex Cable made its debut on the National Stock Exchange of India, marking a significant milestone in its journey. The listing provided investors with an opportunity to participate in the company’s growth story and benefit from its success in the market.
Since its listing on the NSE, Finolex Cable has demonstrated impressive growth and performance. The company’s consistent financial performance, strong balance sheet, and strategic initiatives have contributed to its success in the market. Investors have recognized Finolex Cable as a reliable investment option with the potential for long-term capital appreciation.
The company initially began its operations by manufacturing PVC insulated electrical cables primarily for the automobile industry. Over time, it has expanded its product range significantly. Today, the company offers a diverse array of products including PVC Insulated Industrial Cables, FR-LSH PVC Insulated Industrial Cables, PVC Insulated Single Core and Multicore Flexible Industrial Cables, Rodent Repellent Multicore Flexible Industrial Cables, PVC Insulated Winding Wires, 3 Core Flat Cables, XLPE 3 Core Flat Cables, Power and Control Cables, High Voltage Power Cables (Up to 33 kV), Polyethylene Insulated Jelly Filled Telephone Cables, Auto & Battery Cables, Co-axial and CATV cables, LAN Cables, Switchboard Cables, Fibre Optic Cables, Solar Cables, and more.

Subsidiaries of Finolex Cable
Finolex Finance Ltd: Finolex Finance Ltd, established on April 20, 1992, is an unlisted public company headquartered in Maharashtra. It operates as a public limited company with an authorized share capital of INR 7.00 crores and a total paid-up capital of INR 5.98 crores.
Corning Finolex Optical Fibre Private Limited: Corning Finolex Optical Fibre Private Limited was incorporated on May 2, 2011, as a private company. Registered at the Registrar of Companies in Pune, it functions as a non-government company. With an authorized share capital of Rs. 35,000,000 and a paid-up capital of Rs. 35,000,000, it engages in various business activities.
Finolex Wire Products Limited: Founded on August 9, 1995, Finolex Wire Products Limited operates as a public company, registered at the Registrar of Companies in Pune. It operates as a non-government company with an authorized share capital of Rs. 450,000,000 and a paid-up capital of Rs. 444,800,000. The company is primarily involved in the manufacture of basic precious and non-ferrous metals.
Share Holding Pattern of Finolex Cable
These figures represent significant actions taken by a company that directly influence shareholder value. They signify material changes within the company and have an impact on its stakeholders:
- Promoter Shareholding: 35.92%
- FII (Foreign Institutional Investor) Shareholding: 11.58%
- DII (Domestic Institutional Investor) Shareholding: 5.3%
- MF (Mutual Fund) Shareholding: 10.59%
- Public Shareholding: 36.64%
When evaluating the financial health and performance of a company like Finolex Cable, it’s crucial to delve into various financial ratios across different categories. Here’s a comprehensive analysis of the key ratios for the fiscal years ending in March 2020, 2021, 2022, and 2023.
Fundamental Analysis of Finolex Cable | ||||
Ratio | March 2023 | March 2022 | March 2021 | March 2020 |
Profitability Ratio | ||||
Gross Profit Margin | 20.90% | 21.28% | 23.49% | 24.97% |
Net Profit Margin | 11.19 | 10.73 | 10.21 | 13.98 |
Return on Equity (ROE) | 13.52 | 12.39 | 9.58 | 14.80 |
Liquidity Ratio | ||||
Current Ratio | 10.03 | 9.53 | 9.35 | 8.66 |
Quick Ratio (Acid-Test Ratio) | 7.93 | 7.30 | 6.33 | 6.18 |
Solvency Ratio | ||||
Debt to Equity Ratio | 0.0031 | 0.0001 | 0.0007 | 0.0001 |
Interest Coverage Ratio | 468.31 | 303.34 | 537.12 | 331.54 |
Efficient Ratio | ||||
Inventory Turnover Ratio | 5.34 | 4.21 | 3.07 | 3.66 |
Account Receivable Turnover Ratio | 22.69 | 21.27 | 15.65 | 14.63 |
Valuation Ratio | ||||
Price to earning Ratio (P/E) | 24.65 | 9.64 | 12.63 | 7.97 |
Price to Book Ratio (P/B) | 2.45 | 1.47 | 1.71 | 1.04 |
Growth Ratio | ||||
Earning per Share (EPS) Growth | 32.81 | 26.46 | 18.50 | 26.32 |
Revenue Growth (in Rs. Cr.) | 4,679.24 | 3,919.95 | 2,845.10 | 3,049.19 |
Profitability Ratio
Gross Profit Margin:
The gross profit margin indicates the percentage of revenue retained after accounting for the cost of goods sold. Finolex Cable’s gross profit margin has seen a slight decline from 24.97% in 2020 to 20.90% in 2023, indicating a potential decrease in efficiency in managing production costs.
Net Profit Margin:
The net profit margin reflects the company’s efficiency in managing its expenses relative to its revenue. While there was a slight fluctuation, the net profit margin remained relatively stable over the years, indicating consistent profitability.
Return on Equity (ROE):
ROE measures the profitability of a company relative to its shareholders’ equity. Finolex Cable’s ROE has shown some variability but has generally remained at healthy levels, indicating the company’s ability to generate returns for its shareholders.
Liquidity Ratio
Current Ratio:
The current ratio assesses the company’s ability to meet its short-term obligations with its current assets. Finolex Cable’s current ratio has consistently improved over the years, indicating strengthened liquidity and reduced risk of financial distress.
Quick Ratio (Acid-Test Ratio):
Similar to the current ratio, the quick ratio provides a more stringent assessment of liquidity by excluding inventory from current assets. Finolex Cable’s quick ratio has also shown improvement over the years, indicating enhanced short-term liquidity.
Solvency Ratio
Debt to Equity Ratio:
The debt to equity ratio measures the proportion of debt financing relative to equity financing. Finolex Cable has maintained a very low debt to equity ratio across the years, indicating a conservative approach to financing and reduced financial risk.
Interest Coverage Ratio:
The interest coverage ratio indicates the company’s ability to meet its interest obligations with its earnings before interest and taxes (EBIT). Finolex Cable’s interest coverage ratio has shown variability but has generally remained at comfortable levels, indicating sufficient earnings to cover interest expenses.
Efficiency Ratio
Inventory Turnover Ratio:
The inventory turnover ratio measures how efficiently a company manages its inventory. Finolex Cable’s inventory turnover ratio has improved over the years, indicating better inventory management and reduced holding costs.
Accounts Receivable Turnover Ratio:
This ratio assesses how efficiently the company collects payments from its customers. Finolex Cable’s accounts receivable turnover ratio has also shown improvement, indicating faster collection of receivables and improved cash flow management.
Valuation Ratio
Price to Earnings Ratio (P/E):
The P/E ratio compares the company’s current stock price to its earnings per share (EPS). Finolex Cable’s P/E ratio has increased over the years, suggesting a higher valuation relative to its earnings.
Price to Book Ratio (P/B):
The P/B ratio compares the company’s current market price to its book value per share. Finolex Cable’s P/B ratio has also shown an upward trend, indicating increasing investor confidence in the company’s growth prospects.
Growth Ratio
Earnings per Share (EPS) Growth:
Finolex Cable has demonstrated consistent growth in earnings per share over the years, indicating improving profitability and potential for future earnings growth.
Revenue Growth:
The company’s revenue has shown steady growth over the years, reflecting increased sales and market demand for its products.
In conclusion, Finolex Cable’s fundamental analysis reveals a company with stable profitability, improving liquidity, conservative financial management, efficient operations, and promising growth prospects. Investors may find Finolex Cable an attractive investment option based on its strong financial performance and growth trajectory.
Technical Analysis of Finolex Cable
Technical analysis of Finolex Cable involves evaluating price movements and trading volumes to forecast future price movements. Technical analysis depends on charts and statistical indicators. analysts use various techniques, such as trend analysis, chart patterns, and technical indicators like moving averages or relative strength index (RSI), to identify potential buying or selling opportunities for Finolex Cable. The main goal of technical analysis of Finolex Cable share price is to predict future price movements based on historical data and market psychology, helping investors make informed decisions about when to enter or exit trades. So, bellow we are explaining Various techniques as of 7th May 2024 for technical analysis of Finolex Cable.
Price action and price level of Finolex Cable (As of 7th May 2024) | |||
Price action | Daily Timeframe | Weekly Timeframe | Monthly Timeframe |
Candlestick | Strong Bullish Candlestick | Bullish Continuous Candlestick | Bullish Continuous Candlestick |
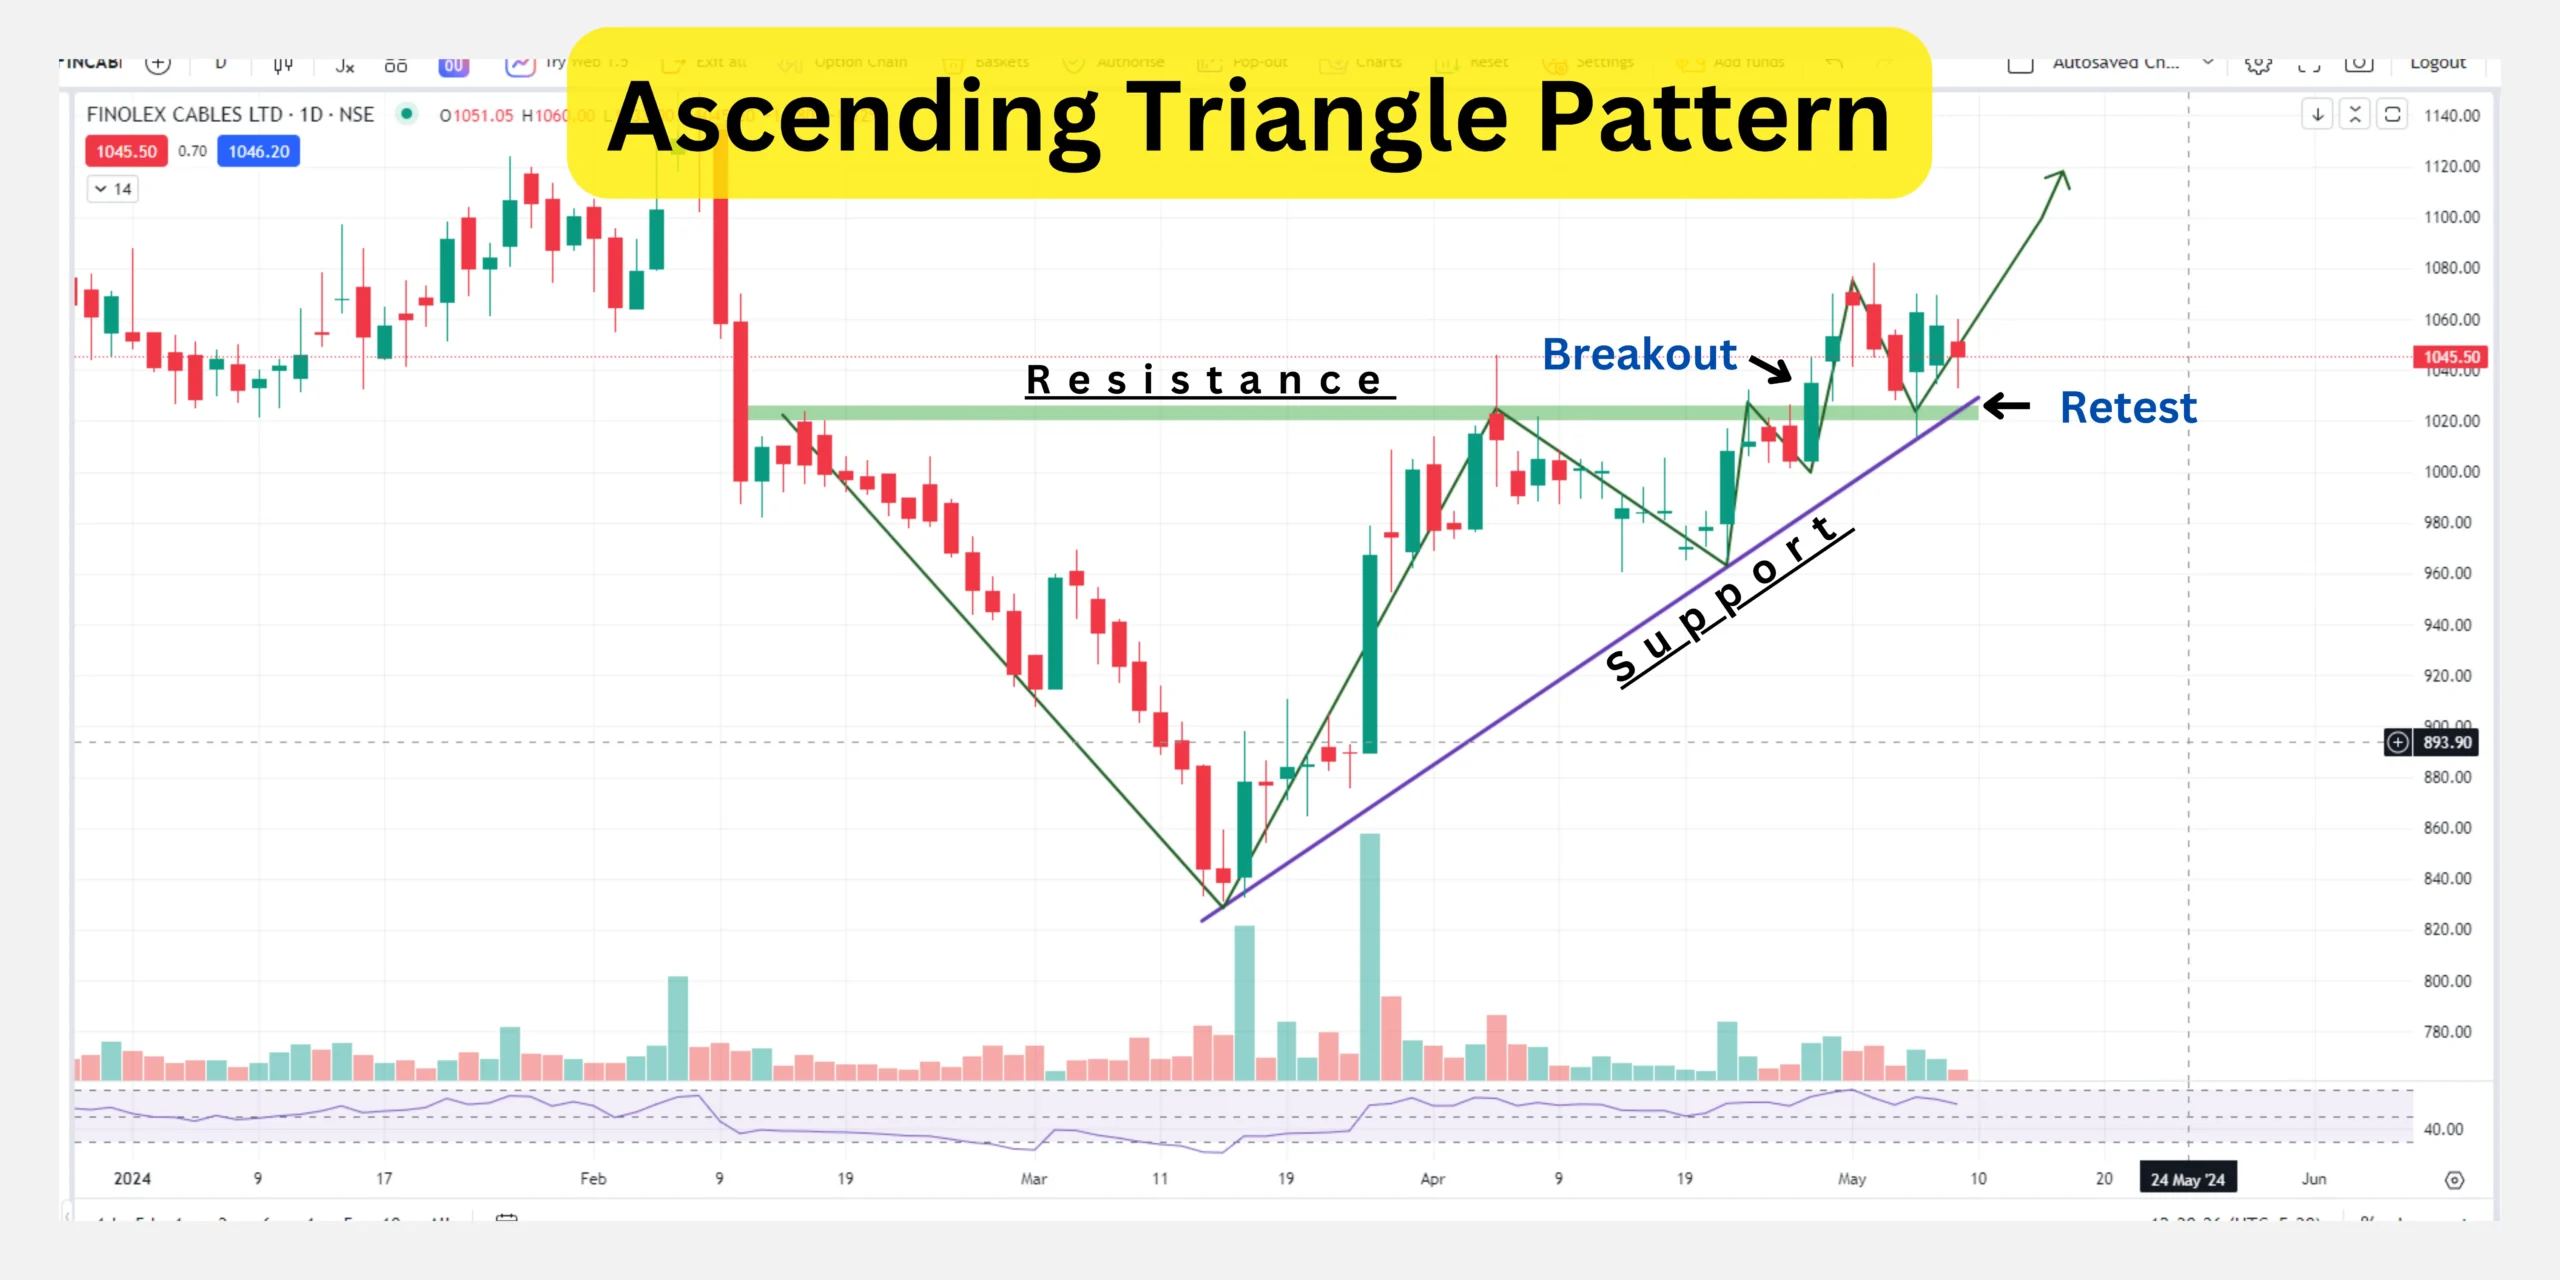
Chart Pattern | Ascending Triangle Pattern | Strong Consolidated Pattern | Strong Consolidated Pattern |
Price Support Level | 1020-1026 | 880-900 | 800-830 |
Price Level | 1045 is Current price | 52 weeks High 1219 | 52 weeks low 774.05 |
Understanding the price action and price levels of Finolex Cable provides investors with crucial insights into the current market sentiment and potential future price movements across different timeframes.

Daily Timeframe
Candlestick:
The daily timeframe reveals a strong bullish candlestick pattern, indicating significant buying pressure in the market. This bullish momentum is further reinforced by the selling rejection observed from the level of 1013, with the price ultimately closing at 1062.50. This suggests that buyers are dominating the market, potentially leading to further upward movement in the short term.
Chart Pattern:
An ascending triangle pattern has been activated on the daily chart, with buyers decisively breaking the horizontal trendline or resistance line and closing above the crucial level of 1026. This breakout is indicative of a bullish continuation pattern, suggesting that the price may continue to rise in the near future.
Price Support Level:
The identified price support level on the daily timeframe lies within the range of 1020-1026. This indicates a zone where buying interest is likely to emerge, providing support to the price during any potential pullbacks.
Weekly Timeframe
Candlestick:

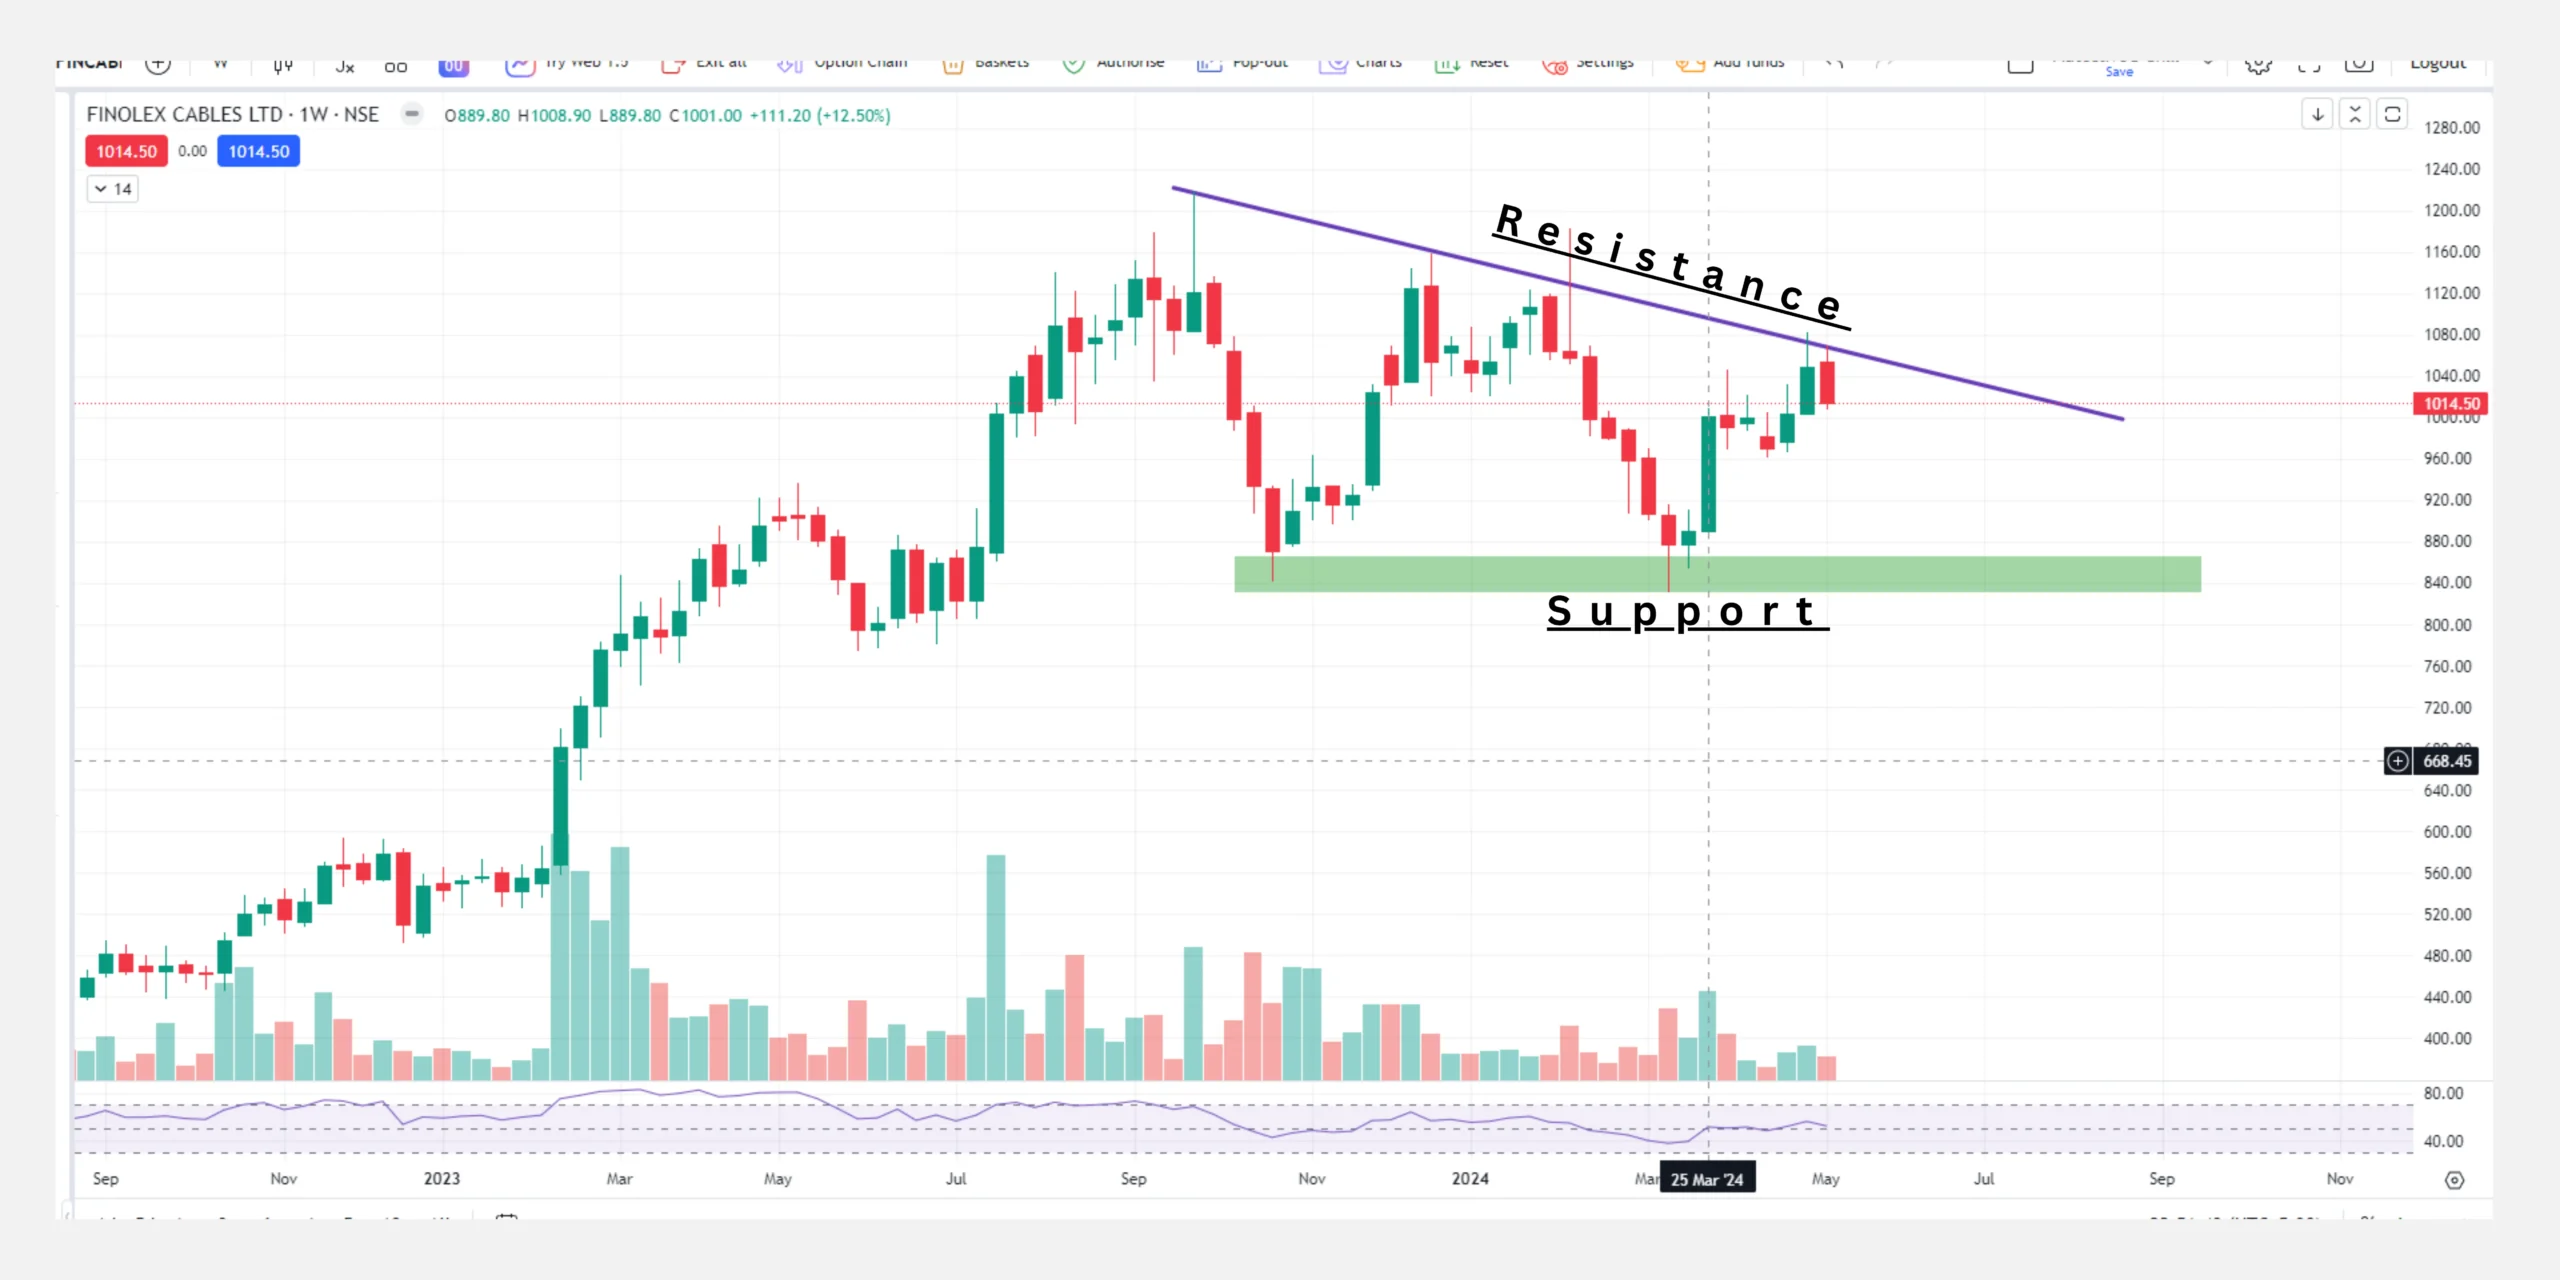
On the weekly timeframe, a bullish continuous candlestick pattern is observed, signaling sustained bullish momentum over the medium term. A notable strong candle formed on March 25th further reinforces this sentiment, with the price holding the upper level from the support. This suggests that buyers remain in control of the market, potentially leading to further upward movement.
Chart Pattern:
A strong consolidated pattern is observed on the weekly chart, indicating a high probability of the price breaking the significant level of 1100. This consolidation phase typically precedes significant price movements and may signal a potential breakout to the upside.
Price Support Level:
The weekly timeframe highlights a price support level between 880-900, indicating a zone where buying pressure may intensify, providing support to the price during any corrective movements.
Monthly Timeframe
Candlestick:
The monthly timeframe displays a bullish continuous candlestick pattern, with a strong bullish candle formed in March. This candlestick pattern is further reinforced by heavy selling rejection observed from the level of 831.25, indicating strong bullish sentiment prevailing over the long term.
Chart Pattern:
Similar to the weekly timeframe, a strong consolidated pattern is observed on the monthly chart, suggesting a high probability of a breakout. This indicates that the price may have the potential to surpass current levels and continue its upward trajectory.
Price Support Level:
The monthly timeframe identifies a price support level between 800-830, indicating a zone where buyers may step in to support the price, preventing significant downside movements.
Price Levels
- The current price of Finolex Cable stands at 1045.
- The 52-week high is recorded at 1219, indicating the highest price level achieved in the past year.
- Conversely, the 52-week low is noted at 774.05, indicating the lowest price level recorded in the past year.
In conclusion, the price analysis of Finolex Cable suggests a predominantly bullish sentiment across different timeframes, with strong buying pressure observed and potential for further upward movement. However, investors should remain vigilant and consider risk management strategies as they navigate the dynamic nature of the market.
Indicators Use for Technical Analysis
Bolinger Band (BB):
Bolinger Band Price level in Finolex Cable (As of 7th May 2024) | |||
| Upper Band | Median | Lower Band |
Bolinger Band | 1067.37 | 1011.56 | 955.74 |
The upper Bollinger Band is currently positioned at 1067.37 and is acting as a resistance level for the price of Finolex Cable. This indicates that the price may face difficulty surpassing this level in the near term. Investors should pay close attention to any price action near this upper band, as a breakout above it could signal further upward movement.
The median of the Bollinger Bands is recorded at 1011.56, coinciding with the exact support level indicated by the daily candlestick pattern. This suggests that the median line is effectively acting as a support level, reinforcing the bullish sentiment observed in the daily timeframe. Traders may consider this level as a potential entry point for long positions.
Positioned at 955.74, the lower Bollinger Band represents the support level corresponding to the weekly candlestick pattern. This implies that the price of Finolex Cable may find support near this level, preventing significant downside movements. Investors should monitor the price action around the lower band, as a breach below it could signal further bearish sentiment.
Moving Average (MA):
Moving Average price level in daily candlestick of Finolex Cable (As of 7th May 2024) | ||
Moving Average | 100 Day | 200 Day |
Simple Moving Average (SMA) | 1015.16 | 1015.07 |
Exponential Moving Average (EMA) | 994.65 | 964.84 |
Examining the moving average price levels in the daily candlestick of Finolex Cable provides valuable insights into the current market sentiment and potential support levels.
Simple Moving Average (SMA):
The 100-day SMA is positioned at 1015.16, coinciding with the exact support level observed in the May 7th candlesticks. This indicates that the 100-day SMA is providing significant support to the price of Finolex Cable, reinforcing bullish sentiment.
Similarly, the 200-day SMA is recorded at 1015.07, also aligning with the exact support level of the May 7th candlesticks. This further strengthens the notion that both the 100-day and 200-day SMAs are acting as crucial support levels for the price.
Exponential Moving Average (EMA):
The 100-day EMA is positioned at 994.65. While not coinciding with the exact support level observed in the May 7th candlesticks, it still serves as an important indicator of support and potential price reversal.
On the other hand, the 200-day EMA is recorded at 964.84, indicating a strong support level. This suggests that the 200-day EMA is providing significant support to the price of Finolex Cable, potentially signaling a bullish bias over the long term.
Conclusion
Considering Finolex Cable’s solid fundamentals, diverse product portfolio, and stable financial performance, it emerges as an attractive investment opportunity. Its consistent profitability, improving liquidity, and conservative financial management highlight its resilience and growth potential. Moreover, technical analysis indicates a predominantly bullish sentiment across different timeframes, suggesting strong buying pressure and potential for further upward movement.
With a track record of innovation, quality, and customer satisfaction, Finolex Cable is well-positioned to capitalize on market opportunities and deliver value to shareholders. Investors seeking a reliable investment option with the potential for long-term capital appreciation should consider Finolex Cable as a favorable addition to their portfolio. However, it’s essential to conduct thorough due diligence and risk assessment before making any investment decisions.
FAQs
- What does Finolex Cable do?
Finolex Cable is a prominent manufacturer of electrical and telecommunication cables, offering a wide range of products for various industries.
- Is Finolex Cable a publicly traded company?
Yes, Finolex Cable is listed on the National Stock Exchange (NSE) of India, providing investors with the opportunity to trade its shares.
- How has Finolex Cable performed financially in recent years?
Finolex Cable has demonstrated consistent growth and profitability, with indicators like gross profit margin and return on equity showing positive trends.
- What are the key subsidiaries of Finolex Cable?
Finolex Cable’s subsidiaries include Finolex Finance Ltd, Corning Finolex Optical Fibre Private Limited, and Finolex Wire Products Limited.
- What factors contribute to Finolex Cable’s success in the market?
Finolex Cable’s success can be attributed to its focus on innovation, quality, customer satisfaction, and expanding product range.
- What are the growth prospects for Finolex Cable?
With a strong market presence and expanding product portfolio, Finolex Cable has promising growth prospects in the electrical and telecommunications industries.
- What risks should investors consider when investing in Finolex Cable?
Risks associated with investing in Finolex Cable may include industry competition, regulatory changes, economic fluctuations, and company-specific challenges.
- How can I invest in Finolex Cable?
Investors can buy Finolex Cable’s shares through stockbrokers or online trading platforms, after conducting thorough research and considering their investment goals.
- Does Finolex Cable pay dividends?
Yes, Finolex Cable has a history of paying dividends to its shareholders, reflecting its commitment to providing returns to investors.
- Where can I find more information about Finolex Cable?
Investors can find more information about Finolex Cable through its official website, financial reports, regulatory filings, and stock market research platforms.


