Discover the world of aerospace excellence with The Boeing Company. Explore its rich history, innovative products, and global presence. Learn about Boeing’s financial performance, investment opportunities, and sustainability initiatives. Stay informed with the latest news and developments.

Welcome aboard as we embark on an exhilarating journey through the skies of aviation excellence with The Boeing Company. Established as an American multinational corporation, Boeing has etched its name in the annals of history with its unparalleled contributions to the aerospace industry. From crafting cutting-edge airplanes to venturing into the realms of rotorcraft, rockets, satellites, and missiles, Boeing stands tall as a beacon of innovation and ingenuity.
Table of Contents
The Boeing Company, an esteemed American multinational corporation, is renowned for its global presence in designing, manufacturing, and distributing airplanes, rotorcraft, rockets, satellites, and missiles. Offering comprehensive services including leasing and product support, Boeing holds a distinguished position as one of the largest aerospace manufacturers worldwide. Notably, it ranks as the fourth-largest defence contractor globally based on 2022 revenue and holds the prestigious title of the largest exporter in the United States in terms of dollar value.
Founded by William Boeing in Seattle, Washington, on July 15, 1916, Boeing’s rich history culminated in the merger with McDonnell Douglas on August 1, 1997, shaping its current corporate identity. As of 2023, the Boeing Company’s headquarters is situated in the Crystal City neighbourhood of Arlington County, Virginia.
Boeing’s organizational structure comprises three primary divisions: Boeing Commercial Airplanes (BCA), Boeing defence, Space & Security (BDS), and Boeing Global Services (BGS). In the fiscal year 2021, Boeing achieved remarkable sales figures amounting to $62.3 billion, solidifying its standing as a leader in the industry.
The esteemed reputation of Boeing is underscored by its impressive rankings on prominent lists such as the Fortune 500, where it secured the 54th position in 2020, and the Fortune Global 500, where it held the 121st rank in the same year.

Analyzing the fundamental aspects of The Boeing Company involves delving into various financial ratios spanning valuation, liquidity, solvency, profitability, and efficiency. These metrics provide insights into the company’s financial health, operational efficiency, and overall performance over the last twelve months.
Fundamental analysis of The Boeing Company | |||||
Ratio | LTM (Last Twelve Months) | September 2023 | September 2022 | September 2021 | September 2020 |
Valuation Ratio | |||||
Price to Earnings Ratio (PE) | -51.64 | -71.07 | -22.43 | -27.57 | -10.19 |
Price to Book Ratio | -6.531 | -9.163 | -7.135 | -7.887 | -6.645 |
Price Earnings to Growth Ratio | -30.4 | 1.252 | -1.376 | 0.423 | -0.006 |
EV to EBITDA | 78.67 | 85.82 | -306.2 | -230.8 | -15.53 |
Liquidity Ratio | |||||
Current Ratio | 1.142 | 1.14 | 1.216 | 1.325 | 1.394 |
Quick Ratio | 0.217 | 0.282 | 0.317 | 0.337 | 0.408 |
Solvency Ratio | |||||
Debt to Equity Ratio | -2.819 | -3.052 | -3.589 | -3.874 | -3.471 |
Interest Coverage Ratio | -0.323 | -0.314 | -1.396 | -1.264 | -5.922 |
Profitability Ratio | |||||
Gross Profit Margin | 10.05% | 9.93% | 5.26% | 4.84% | -9.78% |
Net Profit Margin | -2.81% | -2.86% | -7.59% | -6.89% | -20.53% |
Return on Equity (ROE) | 12.94% | 12.89% | 31.81% | 28.6% | 65.19% |
Return on Invested Capital | -2.58% | -3.03% | -10.97% | -5.96% | -18.44% |
Efficient Ratio | |||||
Inventory Turnover Ratio | 0.824 | 0.879 | 0.807 | 0.752 | 0.781 |
Receivables Turnover Ratio | 6.024 | 7.031 | 5.892 | 5.474 | 5.786 |
Valuation Ratio
Price to Earnings Ratio (PE):
The Price to Earnings Ratio indicates how much investors are willing to pay per dollar of earnings. A negative PE ratio like Boeing’s suggests that the company has experienced losses over the past year. However, it’s important to note the trend over time for a more comprehensive assessment.
Price to Book Ratio:
This ratio compares the market value of the company to its book value, reflecting the relationship between the stock price and the company’s assets. Boeing’s negative Price to Book Ratio suggests that its stock price is trading below its book value, which could be indicative of undervaluation or financial distress.
Price Earnings to Growth Ratio (PEG):
The PEG ratio factors in the company’s earnings growth rate, providing a more nuanced perspective on valuation. A negative PEG ratio indicates a decline in earnings growth, which could raise concerns about the company’s future prospects.
EV to EBITDA:
Enterprise Value to Earnings Before Interest, Taxes, Depreciation, and Amortization (EBITDA) assesses a company’s value relative to its operational earnings. Boeing’s positive EV to EBITDA ratio may suggest that the company’s enterprise value exceeds its EBITDA, which could be a sign of overvaluation.
Liquidity Ratio
Current Ratio:
This ratio measures the company’s ability to meet its short-term obligations with its short-term assets. A current ratio above 1 indicates that Boeing has sufficient current assets to cover its current liabilities, signifying good liquidity.
Quick Ratio:
The Quick Ratio, also known as the Acid-Test Ratio, assesses the company’s ability to meet its immediate liabilities with its most liquid assets. Boeing’s Quick Ratio below 1 suggests that it may struggle to meet its short-term obligations using only its most liquid assets.
Solvency Ratio
Debt to Equity Ratio:
The Debt to Equity Ratio evaluates the proportion of debt financing relative to equity financing. A negative ratio like Boeing’s indicates that the company relies more on equity financing than debt, which could be perceived positively as it signifies lower financial risk.
Interest Coverage Ratio:
This ratio measures the company’s ability to cover its interest expenses with its earnings before interest and taxes (EBIT). A negative interest coverage ratio, as seen with Boeing, indicates that the company’s earnings are insufficient to cover its interest expenses, which could raise concerns about its financial health.
Profitability Ratio
Gross Profit Margin:
The Gross Profit Margin reflects the percentage of revenue that exceeds the cost of goods sold, indicating the company’s efficiency in production. Boeing’s positive Gross Profit Margin suggests that it is generating profit from its core operations.
Net Profit Margin:
The Net Profit Margin measures the percentage of revenue that translates into net profit after accounting for all expenses. Boeing’s negative Net Profit Margin indicates that the company is experiencing losses after accounting for all expenses.
Return on Equity (ROE):
The Return on Equity measures the company’s profitability relative to its shareholders’ equity. Boeing’s positive ROE suggests that it is generating profit from shareholders’ investments.
Return on Invested Capital (ROIC):
The Return on Invested Capital assesses the company’s efficiency in generating returns from its invested capital. Boeing’s negative ROIC indicates that it is not effectively utilizing its invested capital to generate returns.
Efficiency Ratio
Inventory Turnover Ratio:
The Inventory Turnover Ratio evaluates how efficiently Boeing manages its inventory by measuring the number of times inventory is sold and replaced within a specific period. A higher ratio indicates better inventory management.
Receivables Turnover Ratio:
The Receivables Turnover Ratio assesses how efficiently Boeing collects payments from its customers by measuring the number of times receivables are collected within a specific period. A higher ratio indicates faster collection of receivables.
In conclusion, analyzing these financial ratios provides a comprehensive understanding of The Boeing Company’s financial performance and position. It’s important to consider these metrics in conjunction with other qualitative factors to make informed investment decisions.
Technical Analysis of The Boeing Company
Technical analysis of The Boeing Company involves evaluating price movements and trading volumes to forecast future price movements. Technical analysis depends on charts and statistical indicators. analysts use various techniques, such as trend analysis, chart patterns, and technical indicators like moving averages or relative strength index (RSI), to identify potential buying or selling opportunities for The Boeing Company. The main goal of technical analysis of The Boeing Company share price is to predict future price movements based on historical data and market psychology, helping investors make informed decisions about when to enter or exit trades. So, bellow we are explaining Various techniques as of 9th May 2024 for technical analysis of The Boeing Company.
Price action
Price action and price level of The Boeing Company(all numbers are in USD) (As of 9th May 2024) | |||
Price action | Daily Timeframe | Weekly Timeframe | Monthly Timeframe |
Candlestick | Bullish Continuation Candlestick | Strong Bullish Candlestick | Inside Bar Candlestick |
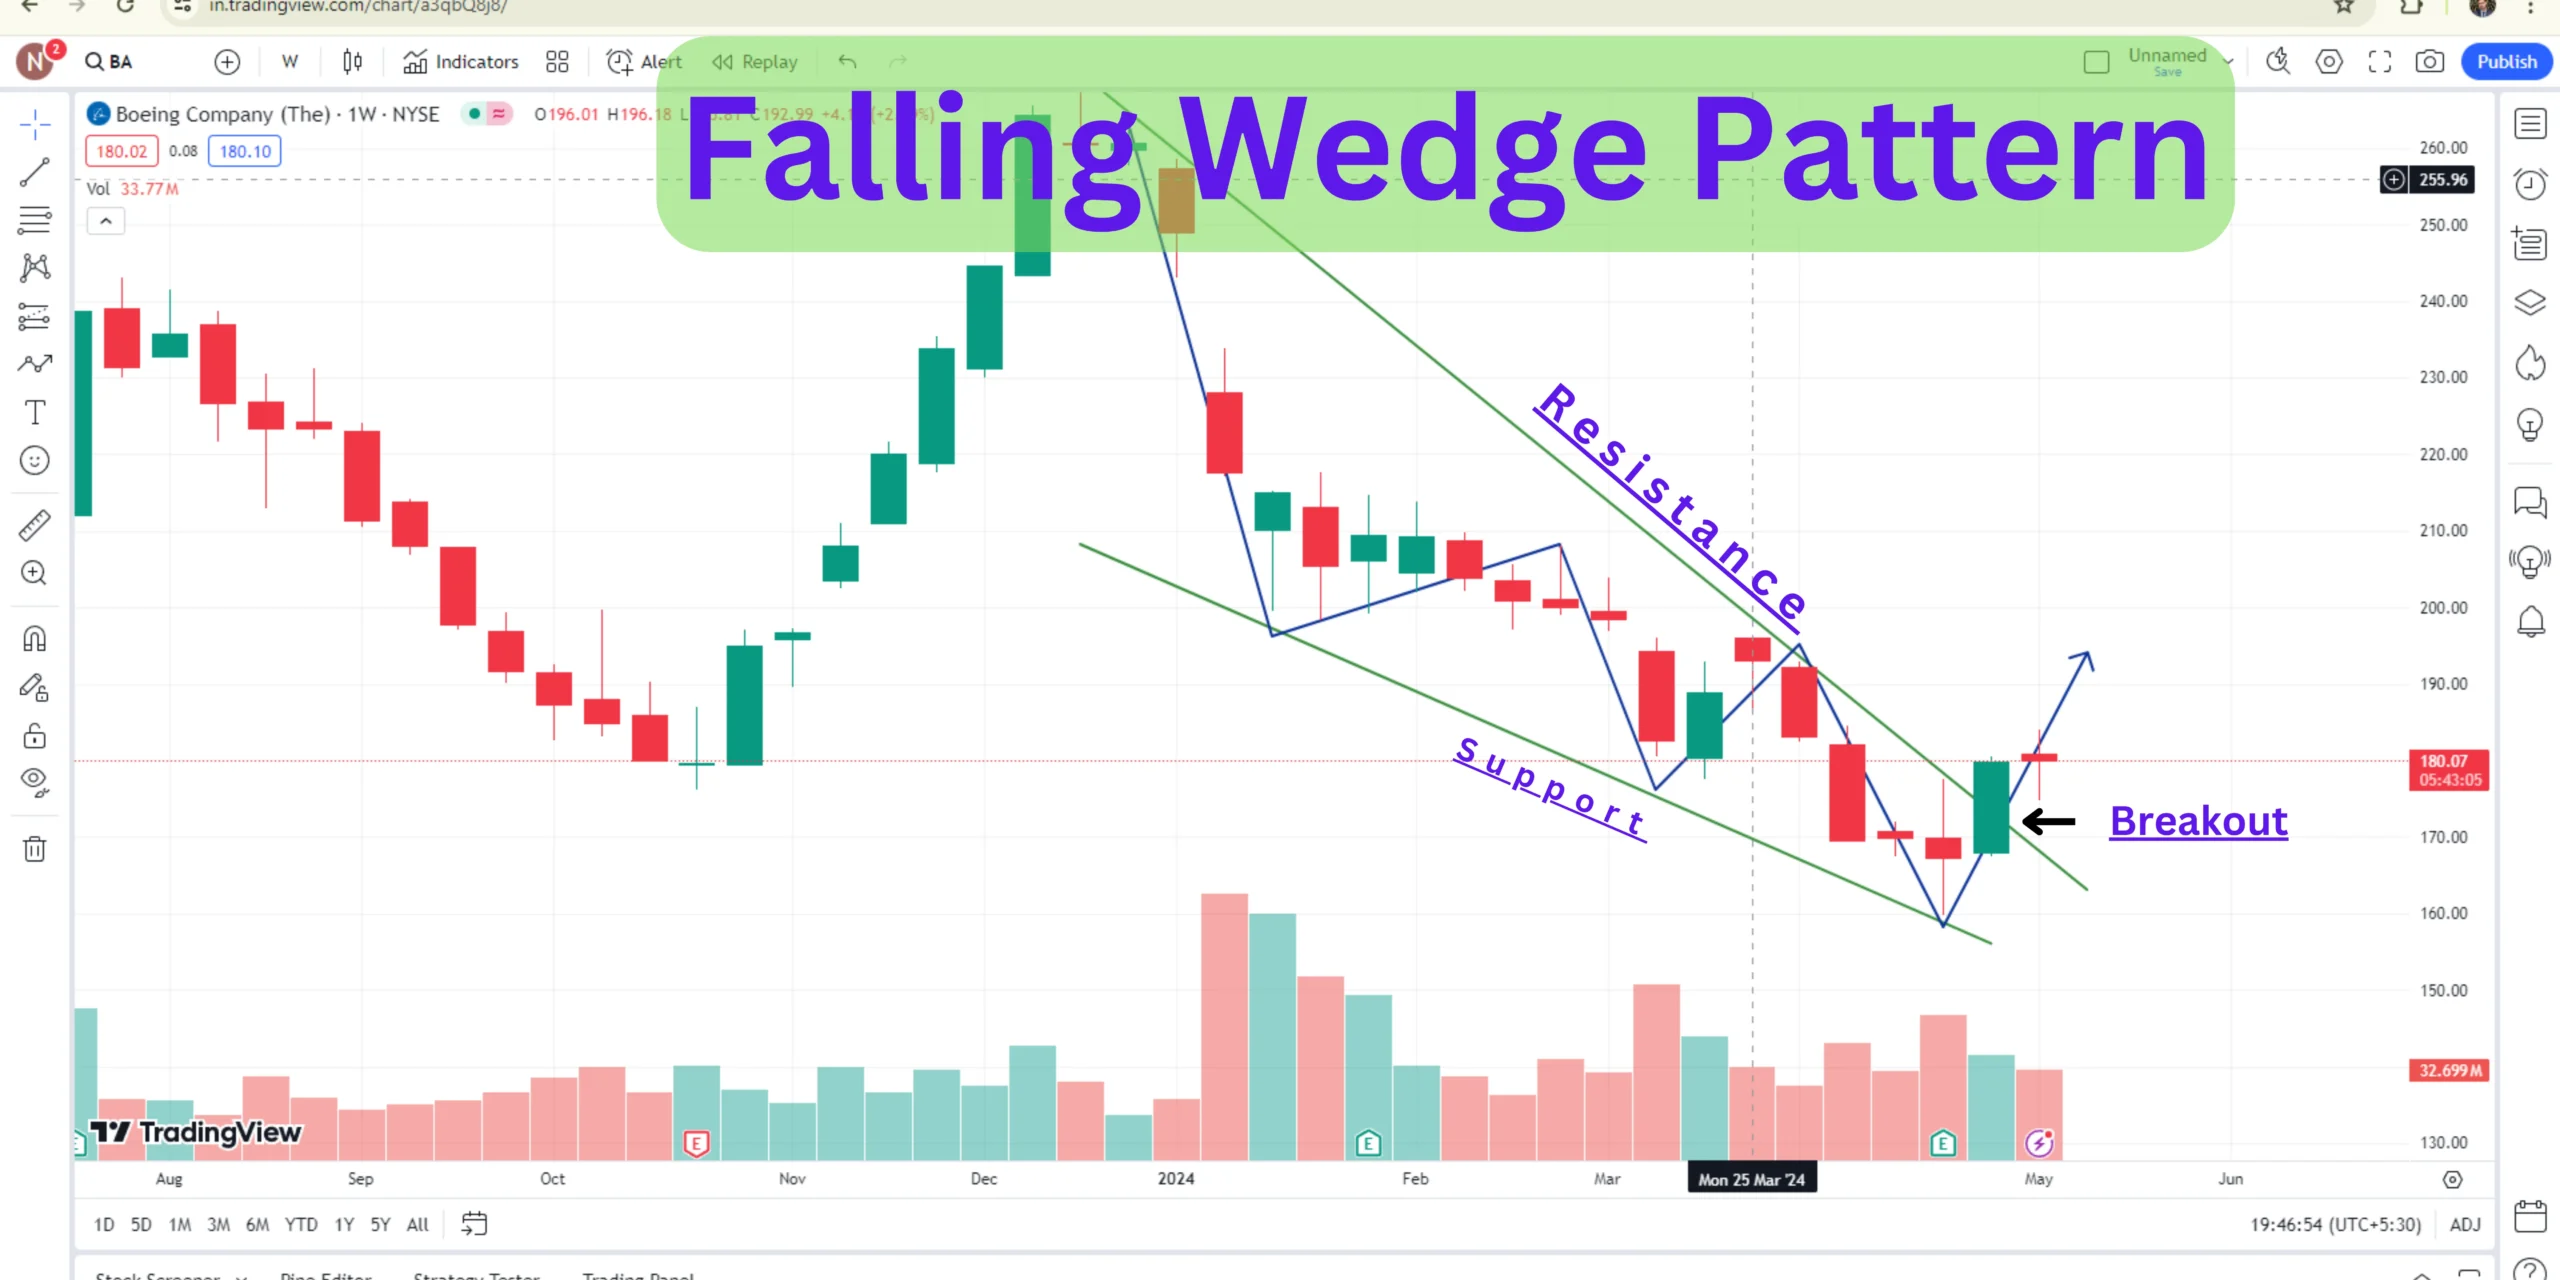
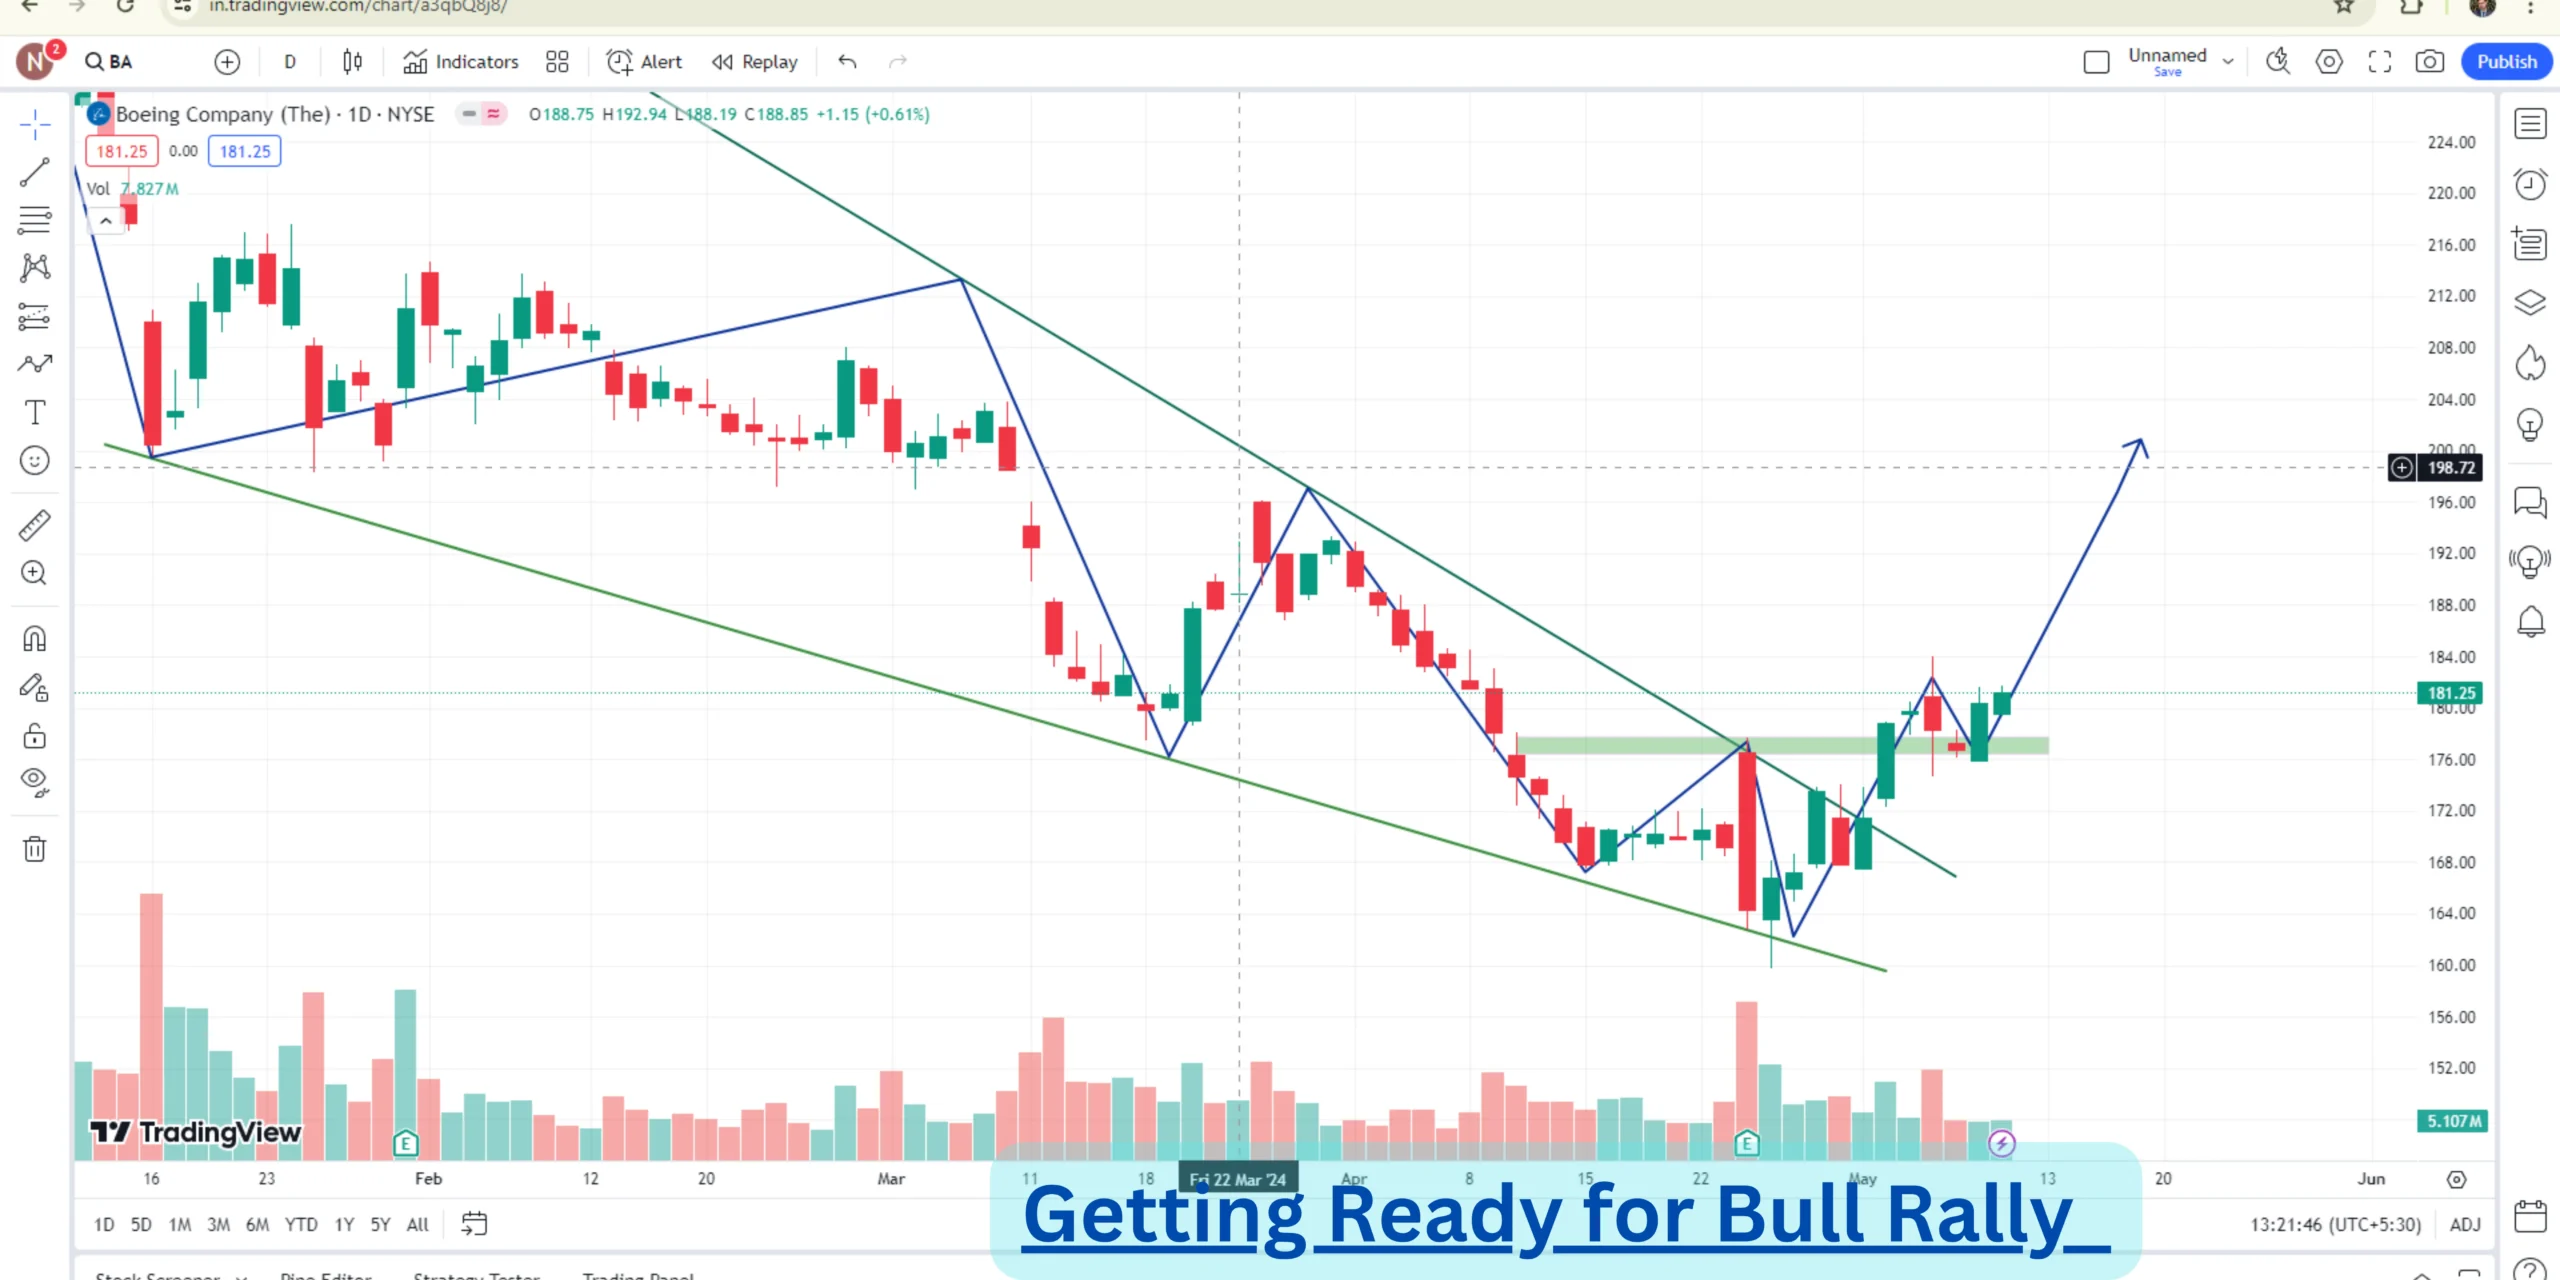
Chart Pattern | “W” Pattern | Falling Wedge Pattern | Bullish Consolidation |
Price Support Level | 175-175 | 167-168 | 160 |
Price Level | 181 is Current price | 52 weeks High 276.54 | 52 weeks low 159.78 |
Analyzing the price action and price levels of The Boeing Company provides valuable insights into its current market dynamics and potential future trends across different timeframes.

Daily Timeframe
Candlestick:
A bullish continuation candlestick pattern emerged on the daily timeframe, indicating a continuation of the upward trend. On May 2nd, the price decisively crossed the crucial level of 176, breaking a pattern and closing at 179, suggesting further bullish momentum.
Chart Pattern:
The “W” pattern activated on the daily chart, indicating a bullish reversal. This pattern broke the resistance line at 176 and is currently holding above the neckline, reinforcing the bullish outlook.
Price Support Level:
The price support level on the daily timeframe lies between 175-176, indicating a zone where the price could find support in the short term, potentially aiding in sustaining the upward momentum.

Weekly Timeframe
Candlestick:
A strong bullish candlestick pattern emerged on the weekly timeframe, signaling robust buying pressure. The breakout occurred on April 29th, propelling the price to close at 179.79 USD, affirming the bullish trend.
Chart Pattern:
A falling wedge pattern activated on the weekly chart, breaking the resistance line and closing above 179. This pattern suggests a bullish reversal, reinforcing the upward trajectory.
Price Support Level:
A strong support zone for the weekly candlestick lies between 167-168 USD, indicating a significant level where buyers may step in to support the price.

Monthly Timeframe
Candlestick:
An inside bar candlestick pattern is forming on the monthly timeframe, indicating a period of consolidation after a strong upward rally. This pattern suggests potential volatility ahead, with the direction of the breakout likely determining the future trend.
Chart Pattern:
A bullish consolidation pattern is observed on the monthly chart, with the potential for a bullish rally if the monthly candle closes above 180 USD. This pattern underscores the bullish sentiment prevailing in the longer-term outlook.
Price Support Level:
The price support level on the monthly timeframe is around 160 USD, serving as a crucial level where buyers may intervene to support the price.
52 Weeks High Low Level
The current price stands at 181 USD, poised to surpass the 52-week high, indicating strong bullish sentiment and potential for further upward movement.
The 52-week high stands at 276.54 USD, showcasing the potential for significant price appreciation from current levels, underlining the bullish sentiment prevailing in the market.
The 52-week low stands at 159.78 USD, indicating a significant price level where the price has found support in the past, highlighting the potential for a rebound in case of further downward movement.
In conclusion, analyzing the price action and price levels of The Boeing Company across different timeframes provides valuable insights for traders and investors, enabling them to make informed decisions based on current market dynamics and potential future trends.
Moving Average (MA):
Moving Average price level in daily candlestick of The Boeing Company (all numbers are in USD) (As of 9th May 2024) | ||
Moving Average | 100 Day | 200 Day |
Simple Moving Average (SMA) | 202.326 | 207.288 |
Exponential Moving Average (EMA) | 192.792 | 200.407 |
Simple Moving Average (SMA):
The 100-day Simple Moving Average currently stands at 202.326 USD. This level indicates that the current price is not significantly distant from the average. If a bullish rally occurs, the price is likely to converge towards this average line, potentially serving as a point of resistance or support depending on the direction of the trend.
The 200-day Simple Moving Average is at 207.288 USD. This suggests that a rally has begun to meet the average line, indicating a potential shift in trend. Traders and investors often pay close attention to the 200-day SMA as it provides insights into long-term trends and can act as a significant level of support or resistance.
Exponential Moving Average (EMA):
The 100-day Exponential Moving Average currently stands at 192.792 USD. Similar to the 100-day SMA, this level indicates that the current price is relatively close to the average. If a bullish rally occurs, the price is likely to converge towards this average line, potentially influencing price action.
The 200-day Exponential Moving Average is at 200.407 USD. This suggests that a rally has begun to meet the average line, similar to the 200-day SMA. The convergence of the price towards the 200-day EMA could signify a significant shift in trend, with the average acting as a crucial level of support or resistance.
In summary, analyzing the moving average price levels in the daily candlestick of The Boeing Company provides traders and investors with valuable insights into the current market dynamics and potential future price movements. The convergence or divergence of the price from these moving averages can serve as important indicators of trend strength and potential reversal points, guiding decision-making processes in trading and investment strategies.
Conclusion
Based on the comprehensive analysis of both fundamental and technical factors, it is recommended to consider The Boeing Company as a potential investment opportunity. However, investors should exercise caution and conduct further research, considering both the strengths and weaknesses highlighted in the analysis. Monitoring the company’s financial performance, market trends, and broader economic factors will be essential in making informed investment decisions. Additionally, consulting with a financial advisor and diversifying one’s portfolio is advisable to mitigate risks associated with individual stock investments.
In summary, while The Boeing Company presents opportunities for potential growth and investment, it is crucial for investors to approach with diligence and prudence, leveraging both fundamental and technical insights to make well-informed decisions aligned with their investment objectives and risk tolerance.
FAQs
- What products and services does The Boeing Company offer?
The Boeing Company specializes in designing, manufacturing, and distributing a wide range of aerospace products, including airplanes, rotorcraft, rockets, satellites, and missiles. Additionally, Boeing provides comprehensive services such as leasing and product support.
- When was The Boeing Company founded?
The Boeing Company was founded on July 15, 1916, by William Boeing in Seattle, Washington. Since then, it has evolved into one of the world’s largest aerospace manufacturers.
- What is the corporate structure of Boeing?
Boeing’s organizational structure comprises three primary divisions:
Boeing Commercial Airplanes (BCA)
Boeing Defence, Space & Security (BDS)
Boeing Global Services (BGS) Each division focuses on different aspects of Boeing’s operations, catering to commercial aviation, defence, and aftermarket services respectively.
- Where is Boeing headquartered?
As of 2023, The Boeing Company’s headquarters is located in the Crystal City neighbourhood of Arlington County, Virginia, United States.
- What are some notable achievements of Boeing?
Boeing has several prestigious achievements, including:
Ranking as the fourth-largest defence contractor globally based on 2022 revenue.
Holding the title of the largest exporter in the United States in terms of dollar value.
Securing positions on prominent lists such as the Fortune 500 and the Fortune Global 500.
- How can I invest in The Boeing Company?
Investors can invest in The Boeing Company by purchasing its stock, which is traded on major stock exchanges such as the New York Stock Exchange (NYSE) under the ticker symbol “BA”. Additionally, investors can consider investing in mutual funds or exchange-traded funds (ETFs) that include Boeing stock within their portfolios.
- What factors should I consider before investing in Boeing?
Before investing in Boeing or any other company, it is essential to consider various factors, including:
Boeing’s financial performance and stability.
Industry trends and market conditions in the aerospace sector.
Regulatory environment and government contracts.
Competitive landscape and technological advancements.
Long-term growth prospects and potential risks associated with the company.
- How can I stay updated with news and developments related to Boeing?
Investors and enthusiasts can stay informed about news and developments related to Boeing by:
Following reputable financial news outlets and industry publications.
Monitoring Boeing’s official website and press releases.
Subscribing to newsletters and alerts from financial analysts and investment platforms.
Engaging with Boeing’s official social media channels for updates and announcements.
- What is Boeing’s environmental and sustainability initiatives?
Boeing is committed to sustainability and environmental stewardship through various initiatives, including:
Developing eco-friendly aircraft technologies to reduce carbon emissions.
Investing in renewable energy and sustainable aviation fuels.
Implementing waste reduction and recycling programs across its operations.
Partnering with stakeholders to promote environmental conservation and responsible resource management.
- How does Boeing contribute to global aviation safety standards?
Boeing prioritizes aviation safety through rigorous testing, research, and adherence to regulatory standards. The company collaborates with industry stakeholders, regulatory agencies, and aviation professionals to develop and implement advanced safety technologies, training programs, and operational protocols aimed at enhancing air travel safety worldwide.

