Discover the latest trends and analysis of UPL Share Price. Stay informed about UPL Limited’s stock performance, key indicators, and investment opportunities.

When analysing investment opportunities, keeping a close eye on UPL Share Price is crucial. As the key indicator of UPL Limited’s performance, formerly United Phosphorus Limited, UPL Share Price reflects market sentiment and the company’s financial health. Headquartered in Mumbai, UPL boasts a global presence, selling its products in 150+ countries. Factors such as its diverse product portfolio and strategic acquisitions impact UPL Share Price. The acquisition of Arysta life Science Inc. in 2019, for instance, significantly influenced UPL Share Price, positioning the company as a major player in the agrochemical industry. For investors seeking insights into market trends and UPL’s growth potential, monitoring UPL Share Price is essential.
Table of Contents
UPL Limited, formerly known as United Phosphorus Limited, operates as an Indian multinational company headquartered in Mumbai. Its diverse portfolio includes manufacturing and marketing agrochemicals, industrial chemicals, chemical intermediates, specialty chemicals, and pesticides. The company is actively involved in both agro and non-agro activities, with the agro-business serving as its primary revenue source. This segment encompasses the production and promotion of conventional agrochemical products, seeds, and other agricultural items.
Additionally, UPL engages in the manufacturing and marketing of industrial chemicals and various non-agricultural products such as fungicides, herbicides, insecticides, plant growth regulators, rodenticides, industrial & specialty chemicals, and nutrifeeds. With a global presence spanning over 150 countries, UPL has solidified its position as a key player in the international market.
Originally established on May 29, 1969, as United Phosphorus Limited, the company rebranded to UPL Limited in October 2013 to reflect its evolving identity and strategic direction. A significant milestone in its journey occurred on July 20, 2018, when UPL finalized a monumental agreement worth US$4.2 billion with Platform Specialty Products Corporation, now Element Solutions Inc., to acquire control of Arysta Life Science Inc. This transformative acquisition, completed in February 2019, propelled UPL into the ranks of the world’s top five generic agrochemicals companies, alongside industry giants Bayer, Corteva, Syngenta, and BASF.

Subsidiaries of UPL Limited
Advanta
Advanta, a prominent subsidiary of UPL, is a leading name in the seed industry. Known for its focus on research, production, and marketing, Advanta pioneers seed innovation, offering high-quality seeds favored by farmers for better yields and sustainable agriculture.
Arysta LifeScience
Arysta LifeScience, another key entity under UPL, specializes in marketing cutting-edge chemical solutions tailored to farmers’ evolving needs. Its diverse product range addresses various farming challenges, ensuring healthy crop growth and productivity.
Bioquim Group
Originating from Costa Rica, the Bioquim Group significantly enhances UPL’s bio-solutions segment. By combining advanced technologies with local expertise, Bioquim provides eco-friendly farming solutions tailored to the unique agricultural landscape of Central America.
Laoting Yoloo Biotechnology Co. Ltd.
Based in China, Laoting Yoloo Biotechnology is a valuable addition to UPL’s portfolio, focusing on innovative bio-solutions aligned with sustainable agriculture. Their eco-friendly products aim to meet modern agricultural demands while addressing environmental concerns.
Share Holding Pattern of UPL Limited
These figures represent significant actions taken by a company that directly influence shareholder value. They signify material changes within the company and have an impact on its stakeholders:
- Promoter Shareholding: 32.55%
- FII (Foreign Institutional Investor) Shareholding: 36.95%
- DII (Domestic Institutional Investor) Shareholding: 8.86%
- MF (Mutual Fund) Shareholding: 6.46%
- Retail and Others: 15.38%
Fundamental analysis of UPL share price involves a comprehensive assessment of the company’s financial health, operational performance, industry position, and market dynamics to evaluate its intrinsic value and investment potential in march 2020-2023 financial years.
Fundamental Analysis of UPL Limited | ||||
Ratio | March 2023 | March 2022 | March 2021 | March 2020 |
Profitability Ratio | ||||
Gross Profit Margin | 49.08% | 42.27% | 41.06% | 38.10% |
Net Profit Margin | 6.66% | 7.84% | 7.42% | 4.97% |
Return on Equity (ROE) | 13.29% | 16.73% | 16.04% | 10.90% |
Liquidity Ratio | ||||
Current Ratio | 1.45 | 1.41 | 1.53 | 1.75 |
Quick Ratio (Acid-Test Ratio) | 0.966 | 0.945 | 1.05 | 1.28 |
Solvency Ratio | ||||
Debt to Equity Ratio | 0.866 | 1.19 | 1.33 | 1.76 |
Interest Coverage Ratio | 2.45 | 3.11 | 3.01 | 2.86 |
Efficient Ratio | ||||
Inventory Turnover Ratio | 2.02 | 2.37 | 2.64 | 2.61 |
Account Receivable Turnover Ratio | 3.19 | 3.02 | 2.77 | 2.63 |
Valuation Ratio | ||||
Price to earning Ratio (P/E) | 15.67 | 16.78 | 17.63 | 14.05 |
Price to Book Ratio (P/B) | 2.08 | 2.08 | 2.06 | 1.10 |
Growth Ratio | ||||
Earning per Share (EPS) Growth | 45.79 | 45.87 | 36.40 | 23.24 |
Revenue Growth (in Rs. Cr.) | 19,245.00 | 17,080.00 | 11,458.00 | 10,147.00 |
Profitability Ratio
Gross Profit Margin:
The Gross Profit Margin indicates the percentage of revenue that remains after deducting the cost of goods sold (COGS). UPL’s Gross Profit Margin has shown a consistent upward trend over the past four years, reaching 49.08% in March 2023 from 38.10% in March 2020. This signifies improved efficiency in production and management of costs.
Net Profit Margin:
The Net Profit Margin reflects the percentage of revenue that remains as net profit after deducting all expenses. Despite slight fluctuations, UPL’s Net Profit Margin has remained relatively stable, indicating consistent profitability over the years.
Return on Equity (ROE):
ROE measures a company’s profitability relative to shareholders’ equity. UPL’s ROE has exhibited steady growth, reflecting efficient utilization of shareholders’ funds to generate profits, with a notable increase from 10.90% in March 2020 to 13.29% in March 2023.
Liquidity Ratio
Current Ratio:
The Current Ratio assesses a company’s ability to meet short-term liabilities with its current assets. UPL’s Current Ratio has declined slightly over the years, indicating a reduction in liquidity, possibly due to increased investment in long-term assets.
Quick Ratio (Acid-Test Ratio):
The Quick Ratio measures a company’s ability to cover immediate liabilities with its most liquid assets. UPL’s Quick Ratio has also experienced a downward trend, suggesting a decrease in the proportion of highly liquid assets available to meet short-term obligations.
Solvency Ratio
Debt to Equity Ratio:
The Debt to Equity Ratio evaluates a company’s reliance on debt financing relative to equity. UPL’s Debt to Equity Ratio has decreased consistently over the years, indicating a reduction in financial leverage and improved financial stability.
Interest Coverage Ratio:
The Interest Coverage Ratio gauges a company’s ability to meet interest obligations with its earnings before interest and taxes (EBIT). UPL’s Interest Coverage Ratio has remained above 2.0, signaling the company’s capacity to cover interest expenses comfortably.
Efficiency Ratio
Inventory Turnover Ratio:
The Inventory Turnover Ratio measures how efficiently a company manages its inventory. UPL’s Inventory Turnover Ratio has decreased gradually, suggesting a longer inventory holding period, which may impact liquidity and working capital management.
Account Receivable Turnover Ratio:
The Account Receivable Turnover Ratio evaluates how efficiently a company collects payments from its customers. UPL’s Account Receivable Turnover Ratio has shown slight fluctuations but remains within a stable range, indicating effective credit management practices.
Valuation Ratio
Price to Earnings Ratio (P/E):
The Price to Earnings Ratio compares a company’s stock price to its earnings per share (EPS). UPL’s P/E Ratio has fluctuated over the years but remains within a reasonable range, suggesting fair valuation relative to earnings.
Price to Book Ratio (P/B):
The Price to Book Ratio compares a company’s market value to its book value. UPL’s P/B Ratio has remained relatively stable, indicating consistent investor confidence in the company’s assets and growth potential.
Growth Ratio
Earning per Share (EPS) Growth:
EPS Growth measures the percentage increase in earnings per share over a specific period. UPL has demonstrated impressive EPS growth, reflecting the company’s ability to generate higher profits and create value for shareholders.
Revenue Growth:
Revenue Growth reflects the percentage increase in total revenue over a specific period. UPL’s Revenue Growth has shown a consistent upward trend, indicating strong demand for its products and services and successful expansion efforts.
In conclusion, UPL Limited’s financial ratios reflect a company with stable profitability, improving efficiency, and solid growth prospects. While certain liquidity and efficiency ratios show slight declines, overall performance remains strong, supported by consistent profitability and revenue growth. Investors should consider these factors alongside broader market trends when evaluating UPL’s investment potential.
Technical Analysis of UPL Limited
Technical analysis of UPL Limited involves evaluating price movements and trading volumes to forecast future price movements. Technical analysis depends on charts and statistical indicators. analysts use various techniques, such as trend analysis, chart patterns, and technical indicators like moving averages or relative strength index (RSI), to identify potential buying or selling opportunities for UPL Limited. The main goal of technical analysis of UPL Limited share price is to predict future price movements based on historical data and market psychology, helping investors make informed decisions about when to enter or exit trades. So, bellow we are explaining Various techniques as of 13th May 2024 for technical analysis of UPL Limited.
Price Action
Price action and price level of UPL Limited (As of 13th May 2024) | |||
Price action | Daily Timeframe | Weekly Timeframe | Monthly Timeframe |
Candlestick | Strong Bullish Candlestick | Continuous Bullish Candlestick Pattern | Bullish Candlestick |
Chart Pattern | rectangle price action pattern | Lower low channel formed | Price showing comfortable support |
Price Support Level | 464-475 | 450-455 | 400-420 |
Price Level | 534 is Current price | 52 weeks High 698.90 | 52 weeks low 447.80 |

Daily Timeframe
Candlestick Pattern:
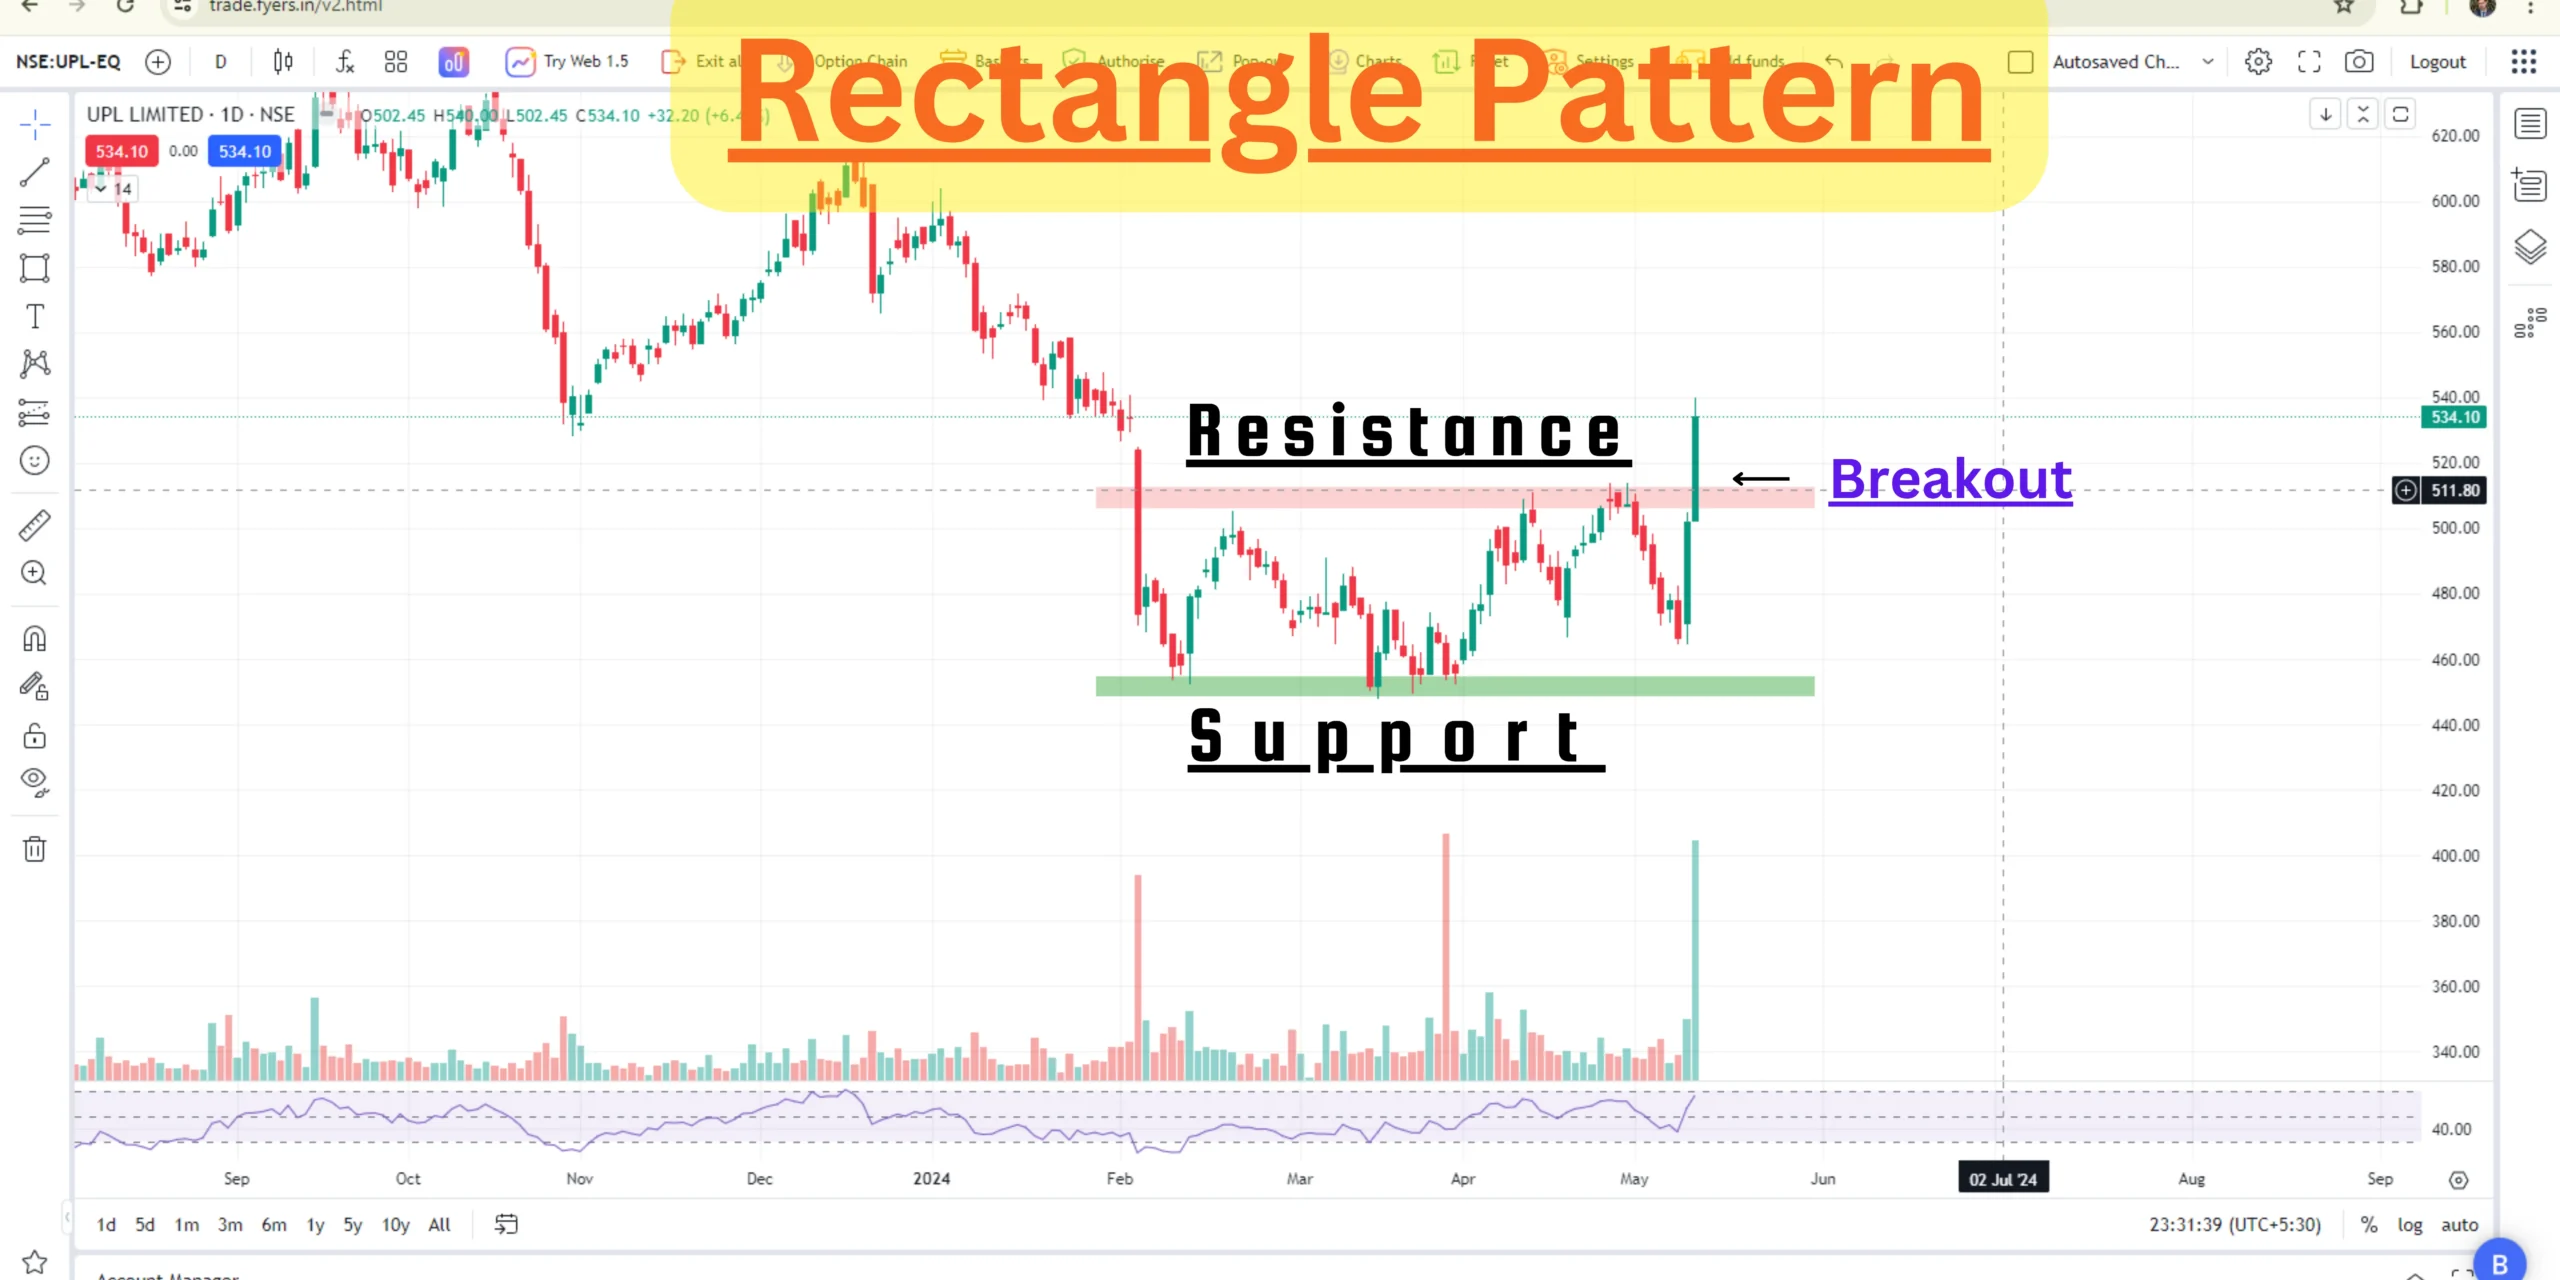
The daily timeframe shows a strong bullish candlestick with excessive volume, indicating significant buying pressure. Buyers successfully breached the resistance level at 512, closing the price at 534.10. Despite a continuous decline since June 2021 and a correction of up to 48% from its peak, recent price action suggests strength for an upward move.
Chart Pattern:
The daily timeframe reveals the activation of a rectangle price action pattern, indicating consolidation in the lower range between 450-512. However, the recent breakout above the 512 level suggests a bullish continuation pattern, with UPL’s share price poised for an upward move.
Price Support Level:
The support level in the daily timeframe is between 464-475, indicating a range where buying pressure may increase, potentially leading to a reversal or continuation of the upward trend.

Weekly Timeframe
Candlestick Pattern:
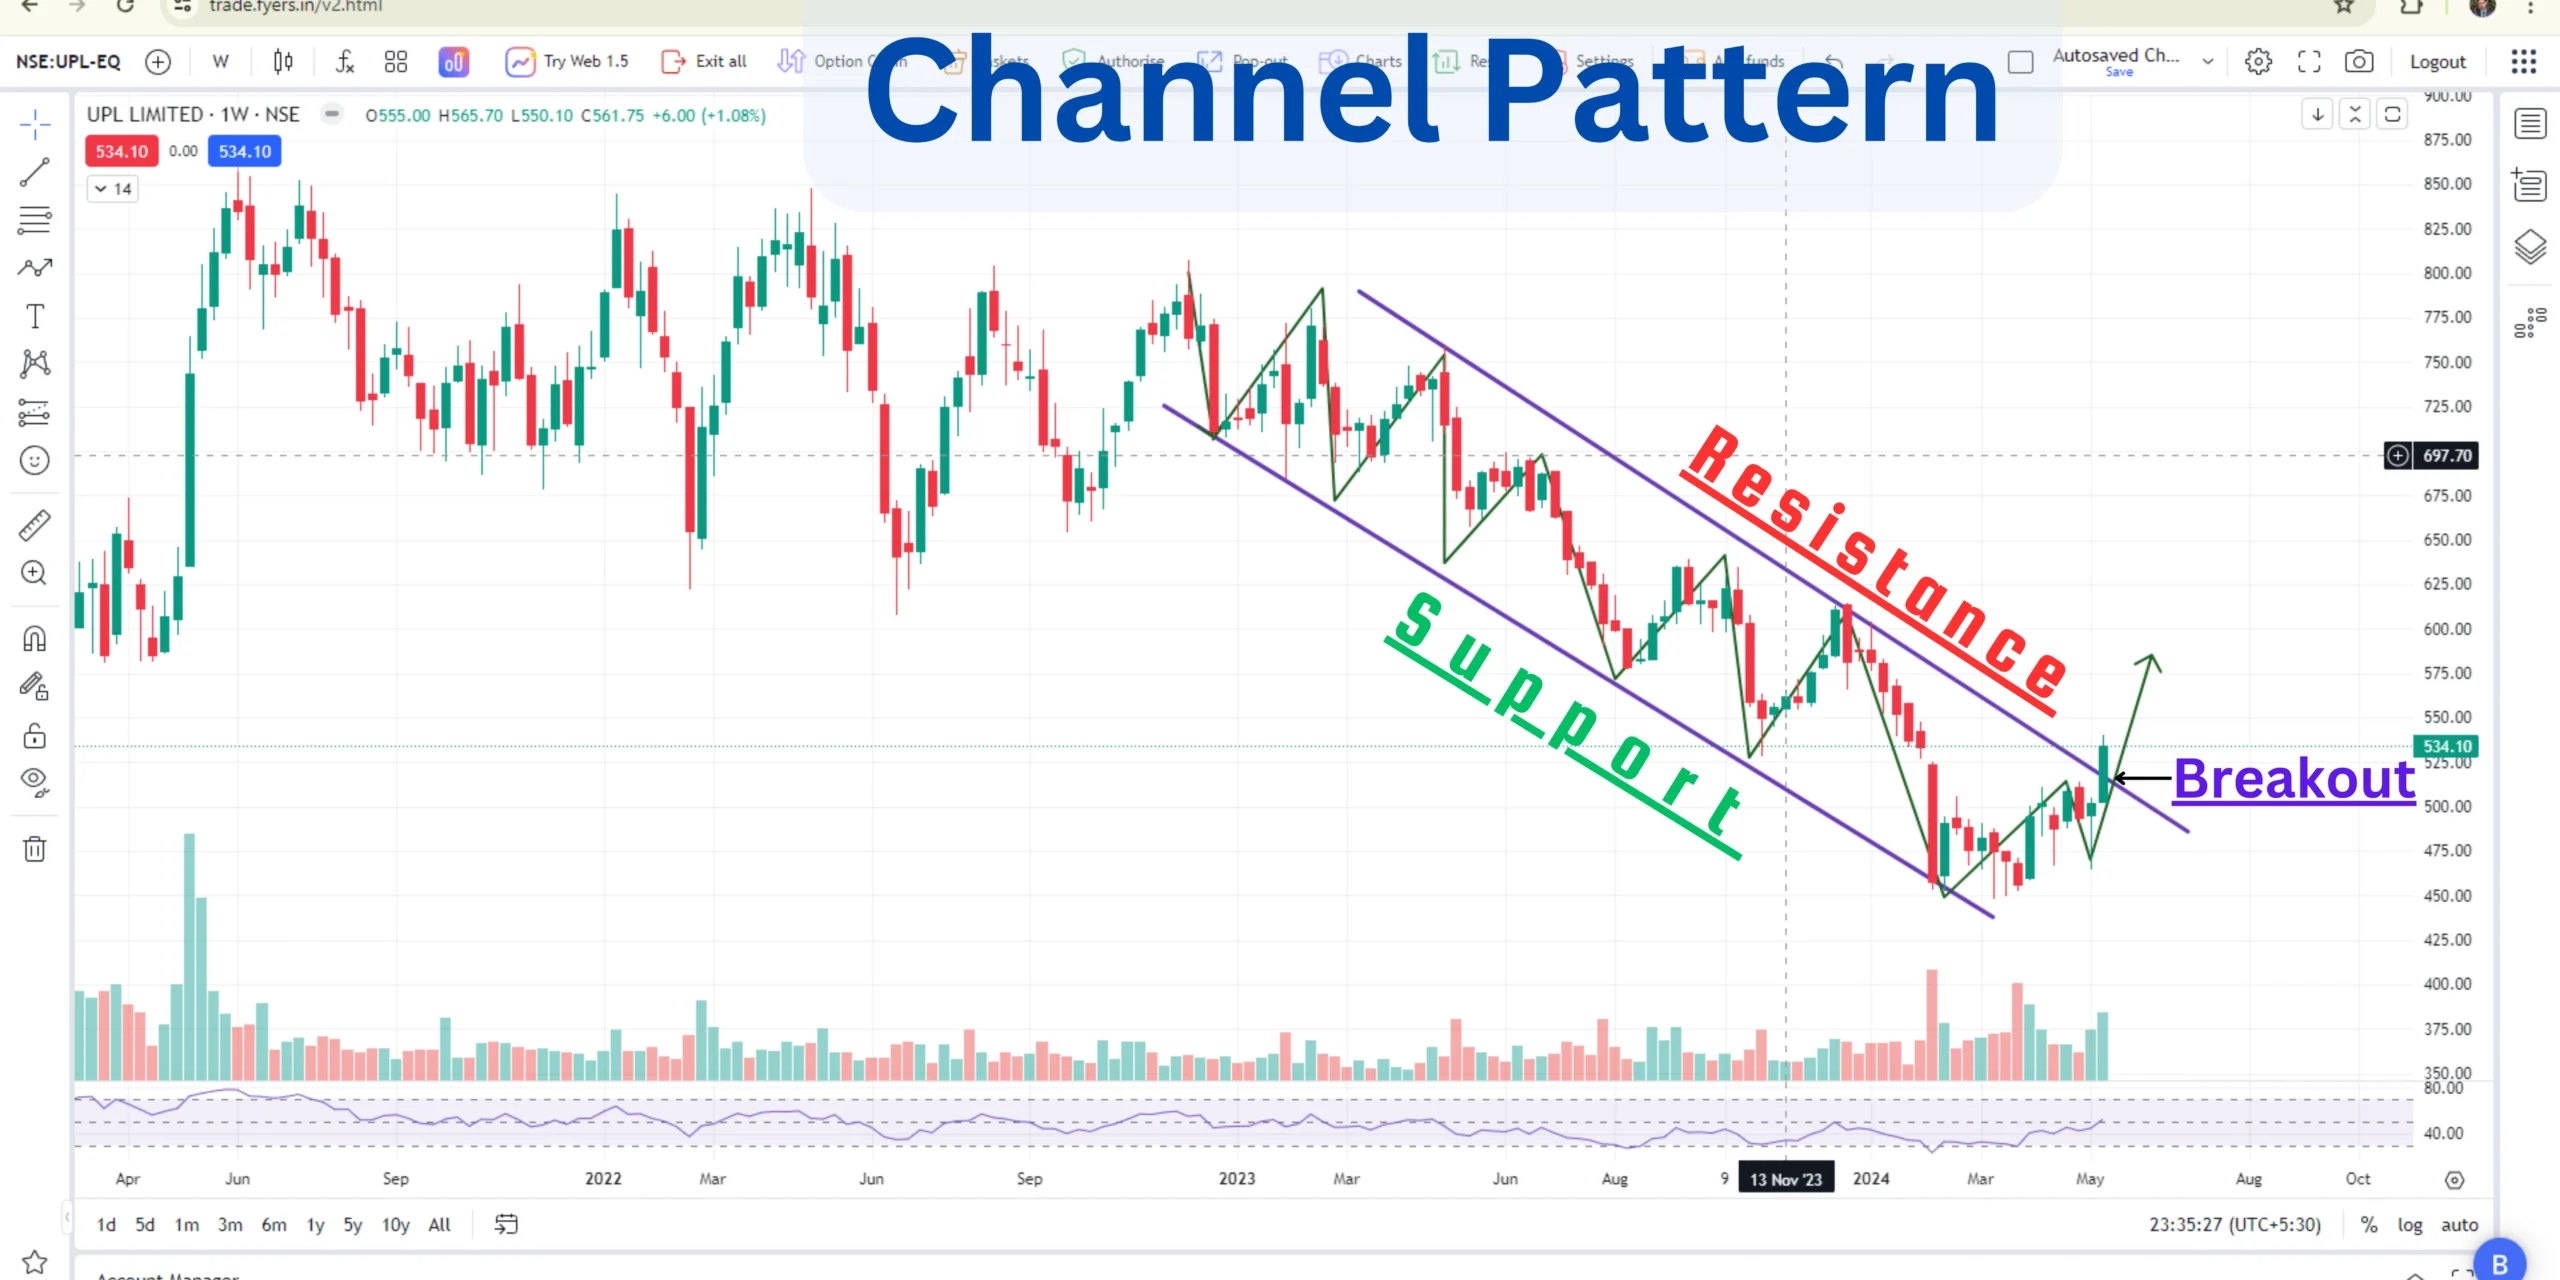
On the weekly timeframe, a continuous bullish candlestick pattern is evident, signalling sustained bullish momentum. The breakout of the channel, which began in February 2023, further reinforces this sentiment. Additionally, the breakout above the resistance trend line indicates a potential continuation of the upward trend.
Chart Pattern:
In the weekly timeframe, a lower low channel had formed previously. However, the recent breakout of this channel suggests a shift towards forming higher highs, indicating increased bullish momentum and the potential for further upside.
Price Support Level:
The support level in the weekly timeframe is between 450-455, with the 52-week low providing additional support to the stock price.

Monthly Timeframe
Candlestick Pattern:
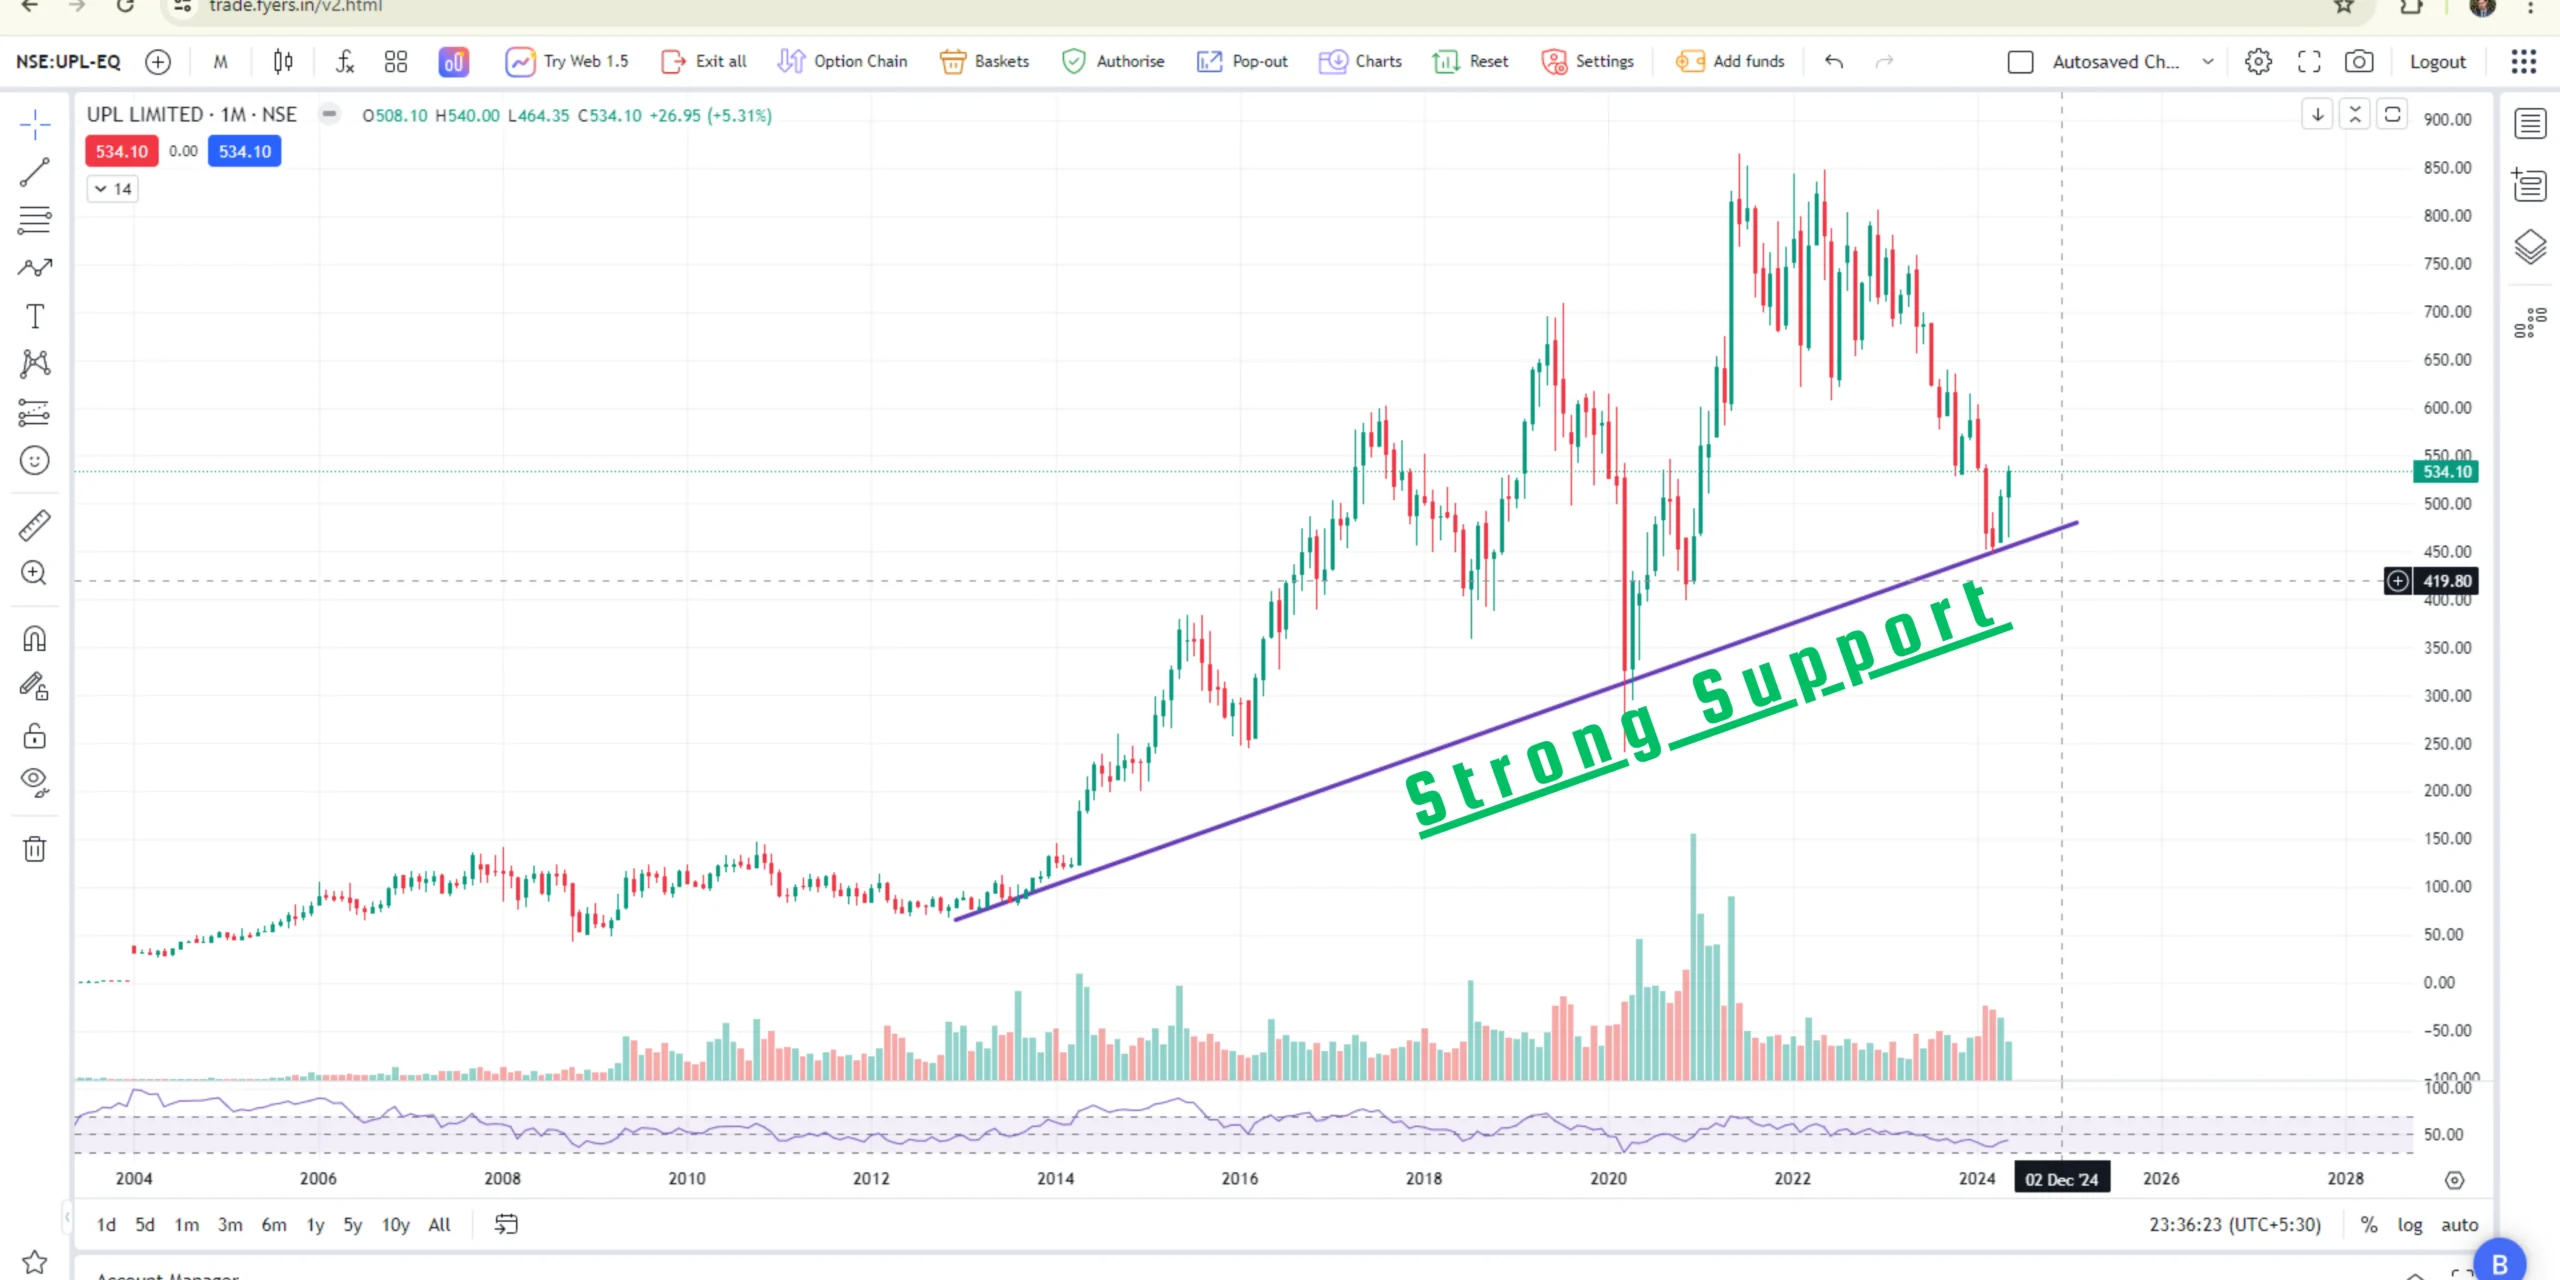
Bullish candlesticks in the monthly timeframe indicate that UPL’s share price is finding support from the trend line. After a prolonged correction phase, the price appears ready to move upward, suggesting a potential reversal in the long-term trend.
Chart Pattern:
On the monthly timeframe, UPL’s share price is showing comfortable support, and slowly volumes are generating. This indicates stability and potential for gradual growth in the stock price.
Price Support Level:
The support level in the monthly timeframe is between 400-420, highlighting a range where significant buying interest may emerge, supporting the stock price.
Price Levels
The current price of UPL’s stock stands at 534 units, representing the latest valuation of the company’s shares in the market.
UPL’s stock reached a high of 698.90 units over the past 52 weeks, reflecting the highest price level attained by the stock during this period. This high point serves as a reference for assessing the stock’s performance relative to its recent peak.
The lowest price point recorded by UPL’s stock over the past 52 weeks is 447.80 units. This low point indicates the minimum price level reached by the stock during this timeframe and provides insight into the stock’s volatility and potential downside risk.
With bullish candlestick patterns across daily, weekly, and monthly timeframes, alongside breakout formations and strong price support levels, UPL Limited exhibits compelling indicators for investment. The current price at 534 units, relative to the 52-week high of 698.90 units and the 52-week low of 447.80 units, suggests potential for growth with limited downside risk. Investors are encouraged to consider adding UPL shares to their portfolio, given the favourable technical signals and support levels indicating a potential uptrend.
Indicators Use for Technical Analysis
Bolinger Band (BB):
Bolinger Band Price level in Astral Limited (As of 10th May 2024) | |||
| Upper Band | Median | Lower Band |
Bolinger Band | 524.01 | 494.40 | 464.80 |
As of May 10th, 2024, Astral Limited’s Bollinger Bands indicate key price levels for investors to consider. The Upper Band stands at 524.01, with the daily candle closing above it, signalling strength in the stock. This suggests potential for further upward movement or a continuation of the current uptrend.
Meanwhile, the Median, positioned at 494.40, serves as a strong support level in the short term, providing a reference point for potential price rebounds or consolidation.
Lastly, the Lower Band, situated at 464.80, offers medium-term support, indicating a level at which buying interest may increase, potentially leading to a reversal or continuation of the stock’s trend. Investors may find these Bollinger Band levels valuable for assessing Astral Limited’s price dynamics and making informed decisions regarding their investment strategies.
Moving Average (MA):
Moving Average price level in daily candlestick of Astral Limited (As of 10th May 2024) | ||
Moving Average | 100 Day | 200 Day |
Simple Moving Average (SMA) | 510.67 | 552.38 |
Exponential Moving Average (EMA) | 510.38 | 550.42 |
In Short- Term:
As of May 10th, 2024, Astral Limited’s daily candlestick charts indicate significant movements in relation to its Moving Average (MA) levels. The Simple Moving Average (SMA) over 100 days stands at 510.67, with the current UPL share price crossing and closing above this level. This suggests a bullish sentiment, indicating potential strength in the stock’s uptrend. Moreover, the Exponential Moving Average (EMA) over 100 days is recorded at 510.38, with the share price also crossing and closing above this threshold. This reinforces the bullish outlook, indicating further potential for upward movement in the stock price.
In Long-Term:
Looking at the longer-term perspective, the 200-day SMA is observed at 552.38, suggesting that the UPL share price is approaching this average line. This could signify a potential level of resistance or consolidation as the stock interacts with this long-term moving average. Similarly, the 200-day EMA stands at 550.42, with the share price poised to approach this average line. Investors may interpret these levels as significant milestones, potentially influencing trading decisions and market sentiment.
Overall, the movement of Astral Limited’s share price in relation to its Moving Average levels indicates a dynamic market environment with potential opportunities for investors. The crossing and closing above both the 100-day SMA and EMA suggest a bullish bias, while approaching the 200-day averages may introduce additional considerations for traders regarding potential resistance or support levels.
Data Analysis
Volume Put Call Ratio of UPL Ltd
Volume Put Call Ratio of UPL Ltd | ||||
Expiry Date | Put Total Contracts | Call Total Contracts | PCR Volume | Signal |
30/05/2024 | 68898.00 | 157552.00 | 0.437 | Bullish |
27/06/2024 | 636.00 | 834.00 | 0.763 | Neutral |
The Volume Put Call Ratio (PCR) for UPL Ltd. indicates the ratio of put options contracts to call options contracts traded on specific expiry dates. A PCR below 1 suggests a higher volume of call options relative to put options, indicating bullish sentiment in the market. Conversely, a PCR above 1 indicates a higher volume of put options compared to call options, signalling bearish sentiment.
As of the expiry date on May 30th, 2024, the PCR stands at 0.437, reflecting a bullish sentiment. This suggests that there are more call options contracts traded compared to put options contracts, indicating optimism among investors about the future direction of UPL Ltd.’s stock price.
On the other hand, for the expiry date on June 27th, 2024, the PCR is 0.763, which falls within the neutral range. This implies a balanced sentiment in the market, with a relatively equal volume of put and call options contracts being traded.
Conclusion
In conclusion, UPL Limited presents a compelling investment opportunity based on both technical and fundamental analyses. The company’s solid financial performance, highlighted by consistent profitability, improving efficiency, and robust growth prospects, provides a strong foundation for long-term value creation. Additionally, UPL’s diverse portfolio, global presence, and strategic acquisitions position it as a key player in the agrochemical industry, offering investors exposure to a stable and growing market.
On the technical front, UPL’s share price demonstrates bullish signals across multiple timeframes, supported by strong candlestick patterns, breakout formations, and price support levels. The current price level of 534 units, relative to the 52-week high and low, suggests potential for growth with limited downside risk. Moreover, indicators such as the Bolinger Bands and Moving Averages provide further insights into potential price movements and support levels, aiding investors in making informed decisions.
Considering the favourable technical signals, alongside UPL’s robust fundamentals and market positioning, we recommend adding UPL shares to investment portfolios. However, investors should conduct thorough due diligence and consider their risk tolerance and investment objectives before making any investment decisions. UPL Limited’s strong fundamentals and promising technical indicators indicate a potential opportunity for long-term capital appreciation.
FAQs
- What is UPL Limited?
UPL Limited, formerly known as United Phosphorus Limited, is an Indian multinational company headquartered in Mumbai. It operates in the agrochemical industry, manufacturing and marketing a wide range of agrochemicals, industrial chemicals, chemical intermediates, specialty chemicals, and pesticides.
- When was UPL Limited Established?
UPL Limited was originally established on May 29, 1969, as United Phosphorus Limited. It rebranded to UPL Limited in October 2013 to reflect its evolving identity and strategic direction.
- What are UPL’s Main Business Segments?
UPL’s main business segments include agrochemicals, industrial chemicals, chemical intermediates, and specialty chemicals. The agrochemical segment is its primary revenue source, involving the production and promotion of conventional agrochemical products, seeds, and other agricultural items.
- Where does UPL operate?
UPL operates globally, selling its products in over 150 countries. It has a strong presence in both developed and emerging markets, catering to the needs of farmers and industries worldwide.
- What are UPL’s Subsidiaries?
UPL’s key subsidiaries include Advanta, Arysta LifeScience, Bioquim Group, and Laoting Yoloo Biotechnology Co. Ltd. These subsidiaries play vital roles in expanding UPL’s product offerings and market reach.
- What is UPL’s Financial Performance?
UPL has demonstrated stable profitability, improving efficiency, and solid growth prospects over the years. Its financial ratios reflect consistent profitability, steady revenue growth, and efficient utilization of resources.
- How has UPL’s Stock Price Performed?
UPL’s stock price has exhibited both growth and volatility, influenced by factors such as market conditions, industry dynamics, and company performance. Investors should conduct thorough analysis before investing in UPL’s stock.
- What Technical Indicators Should Investors Consider?
Investors may consider technical indicators such as candlestick patterns, chart patterns, moving averages, and volume put-call ratios to analyse UPL’s stock price movements and identify potential buying or selling opportunities.
- Is UPL’s Stock Suitable for Long-Term Investment?
UPL’s stable financial performance, global presence, and strategic acquisitions position it as a potential candidate for long-term investment. However, investors should assess their risk tolerance and investment objectives before making investment decisions.
- Where can I find more information about UPL Limited?
For more information about UPL Limited, including financial reports, investor presentations, and company updates, investors can visit UPL’s official website or refer to reputable financial news sources and investment research platforms.

