Discover a detailed analysis of Balkrishna Industries share price. Gain insights into key factors influencing its performance, including fundamental metrics, technical indicators, and market sentiment. Stay informed with expert analysis and forecasts to make well-informed investment decisions.

The Balkrishna Industries share price serves as a crucial metric in assessing the performance and market sentiment surrounding the company. Traded on both the National Stock Exchange (NSE) and the Bombay Stock Exchange (BSE), the fluctuations in Balkrishna Industries share price reflect investor perceptions, industry trends, and broader market dynamics. As a leading player in the tire industry, Balkrishna Industries share price movements are closely monitored by investors and analysts alike, providing insights into the company’s financial health and its positioning within the competitive landscape.
Balkrishna Industries Limited (BKT) stands as an Indian multinational tire manufacturing giant headquartered in Mumbai, India. Specializing in off-highway tires for niche sectors including mining, agriculture, and gardening, BKT operates from five production facilities situated in Aurangabad, Bhiwadi, Chopanki, Dombivali, and Bhuj. Recognized globally, BKT ranked 41st among the world’s tire manufacturers in 2013. Apart from its industrial endeavors, BKT actively sponsors sports competitions across various countries.
Since its inception in 1987 with the establishment of its first off-highway tire manufacturing plant in Aurangabad, BKT has expanded its operations significantly. With subsequent expansions into Dubai (2002) and Chopanaki (2006), the company diversified its product range to include tires for ATV, earthmoving, and gardening vehicles.
Serving as an original equipment manufacturer (OEM) for heavy equipment giants like JCB, John Deere, and CNH Industrial, BKT held an 8% market share in the global off-the-road tire segment in 2014. Predominantly catering to the replacement market in North America and Europe, BKT’s North American base is in Akron, Ohio, with a warehouse in Wando, South Carolina. Notably, approximately 80% of BKT’s business in the United States revolves around the farm market.
Registered as a public limited company on 20 November 1961, Balkrishna Industries Limited embarked on its journey in the stock market with listings on the National Stock Exchange (NSE) and the Bombay Stock Exchange (BSE). Its exceptional performance since then has earned it a coveted position in prestigious indices such as the Nifty Midcap 100 and the S&P BSE 500.

Subsidiaries of Balkrishna Industries Limited (BKT)
- BKY Tires (Canada) INC
- BKT USA Inc
- BKT Tyres Limited
- BKT (Europe) SRL
- BKT Tires Inc
- BKT Exim Limited
- BKT Exim Us, Inc
- BKT (Europe) Ltd
Share Holding Pattern of Balkrishna Industries Limited (BKT)
These figures represent significant actions taken by a company that directly influence shareholder value. They signify material changes within the company and have an impact on its stakeholders:
- Promoter Shareholding: 58.29%
- FII (Foreign Institutional Investor) Shareholding: 12.24%
- DII (Domestic Institutional Investor) Shareholding: 7.45%
- MF (Mutual Fund) Shareholding: 14.63%
- Retail and Others: 7.39%
Balkrishna Industries Ltd. is a renowned player in the tire industry, known for its quality products and consistent performance. To gain deeper insights into the company’s financial health and operational efficiency, let’s analyze and interpret the key ratios from the data table spanning from March 2020 to March 2023.
Fundamental Analysis of Balkrishna Industries Ltd | ||||
Ratio | March 2023 | March 2022 | March 2021 | March 2020 |
Profitability Ratio | ||||
Gross Profit Margin | 49.64% | 54.46% | 55.13% | 49.45% |
Net Profit Margin | 10.99 | 17.06 | 20.06 | 19.75 |
Return on Equity (ROE) | 13.99% | 20.70% | 19.63% | 19.16% |
Liquidity Ratio | ||||
Current Ratio | 1.17 | 1.20 | 1.31 | 1.23 |
Quick Ratio (Acid-Test Ratio) | 0.675 | 0.687 | 0.811 | 0.838 |
Solvency Ratio | ||||
Debt to Equity Ratio | 0.442 | 0.365 | 0.167 | 0.186 |
Interest Coverage Ratio | 30.87 | 217.70 | 137.57 | 106.60 |
Efficient Ratio | ||||
Inventory Turnover Ratio | 2.94 | 2.89 | 3.20 | 3.54 |
Account Receivable Turnover Ratio | 8.83 | 7.57 | 6.25 | 5.34 |
Valuation Ratio | ||||
Price to earning Ratio (P/E) | 35.68 | 28.77 | 27.72 | 15.95 |
Price to Book Ratio (P/B) | 54.70 | 74.25 | 60.91 | 49.64 |
Growth Ratio | ||||
Earning per Share (EPS) Growth | 73.09 | 46.03 | 39.38 | 43.87 |
Revenue Growth | 10,148.31 | 8,697.31 | 5,919.37 | 5,031.26 |
Profitability Ratios
Gross Profit Margin:
The gross profit margin indicates the percentage of revenue retained after accounting for the cost of goods sold (COGS). Balkrishna Industries witnessed a slight decline in gross profit margin from 55.13% in March 2021 to 49.64% in March 2023. This decrease could be attributed to various factors such as rising production costs or pricing pressures in the market.
Net Profit Margin:
The net profit margin represents the percentage of revenue remaining as net income after deducting all expenses. Balkrishna Industries’ net profit margin decreased from 20.06% in March 2021 to 10.99% in March 2023. This decline suggests that the company’s profitability has been affected, possibly due to increased operating expenses or other factors impacting bottom-line performance.
Return on Equity (ROE):
ROE measures the company’s ability to generate profit from shareholders’ equity. Balkrishna Industries’ ROE declined from 19.63% in March 2021 to 13.99% in March 2023. While still positive, this downward trend indicates a decrease in the efficiency of utilizing shareholders’ equity to generate returns.
Liquidity Ratios
Current Ratio:
The current ratio indicates the company’s ability to meet short-term obligations with its current assets. Balkrishna Industries’ current ratio decreased slightly from 1.31 in March 2021 to 1.17 in March 2023. Although still above 1, suggesting the company can cover its short-term liabilities, the declining trend warrants attention and further analysis.
Quick Ratio (Acid-Test Ratio):
The quick ratio measures the company’s ability to meet short-term obligations using its most liquid assets. Balkrishna Industries’ quick ratio also experienced a decline from 0.811 in March 2021 to 0.675 in March 2023. This indicates a potential liquidity squeeze, as the company may struggle to cover its immediate liabilities with its liquid assets alone.
Solvency Ratios
Debt to Equity Ratio:
The debt to equity ratio signifies the proportion of debt used to finance the company’s operations relative to shareholders’ equity. Balkrishna Industries’ debt to equity ratio increased from 0.167 in March 2021 to 0.442 in March 2023. This suggests a higher reliance on debt financing, which may increase financial risk and interest expenses.
Interest Coverage Ratio:
The interest coverage ratio indicates the company’s ability to cover its interest obligations with its earnings before interest and taxes (EBIT). Balkrishna Industries’ interest coverage ratio fluctuated over the years, from 137.57 in March 2021 to 30.87 in March 2023. While still above 1, indicating the company can meet its interest obligations, the decreasing trend raises concerns about its ability to service debt comfortably.
Efficiency Ratios
Inventory Turnover Ratio:
The inventory turnover ratio measures how efficiently the company manages its inventory. Balkrishna Industries’ inventory turnover ratio remained relatively stable over the years, indicating consistent inventory management practices.
Accounts Receivable Turnover Ratio:
The accounts receivable turnover ratio reflects how efficiently the company collects payments from its customers. Balkrishna Industries’ accounts receivable turnover ratio improved from 5.34 in March 2020 to 8.83 in March 2023, suggesting enhanced efficiency in collecting receivables.
Valuation Ratios
Price to Earnings Ratio (P/E):
The P/E ratio compares the company’s current share price to its earnings per share (EPS), indicating investor sentiment and valuation. Balkrishna Industries’ P/E ratio increased from 27.72 in March 2021 to 35.68 in March 2023, suggesting higher investor expectations for future earnings growth.
Price to Book Ratio (P/B):
The P/B ratio compares the company’s market value to its book value, indicating whether the stock is undervalued or overvalued. Balkrishna Industries’ P/B ratio fluctuated over the years, reflecting changes in market sentiment and investor perception of the company’s intrinsic value.
Growth Ratios
Earnings per Share (EPS) Growth:
Balkrishna Industries’ EPS growth showed an upward trend over the years, indicating improved profitability and earnings performance.
Revenue Growth:
The revenue growth of Balkrishna Industries experienced steady growth over the years, reflecting the company’s ability to increase sales and expand its market presence.
In conclusion, the analysis of Balkrishna Industries’ key ratios provides valuable insights into its financial performance, operational efficiency, and market valuation. While certain ratios have shown positive trends, others have exhibited areas of concern that warrant further investigation and strategic planning to ensure long-term sustainability and growth for the company.
Technical Analysis of Balkrishna Industries Ltd
Technical analysis of Balkrishna Industries share price involves evaluating price movements and trading volumes to forecast future price movements. Technical analysis depends on charts and statistical indicators. analysts use various techniques, such as trend analysis, chart patterns, and technical indicators like moving averages or relative strength index (RSI), to identify potential buying or selling opportunities for Balkrishna Industries share price. The main goal of technical analysis of Balkrishna Industries Ltd is to predict future price movements based on historical data and market psychology, helping investors make informed decisions about when to enter or exit trades. So, bellow we are explaining Various techniques as of 15th May 2024 for technical analysis of Balkrishna Industries share price.
Price Action
Price action and price level of Balkrishna Industries share price (As of 15th May 2024) | |||
Price action | Daily Timeframe | Weekly Timeframe | Monthly Timeframe |
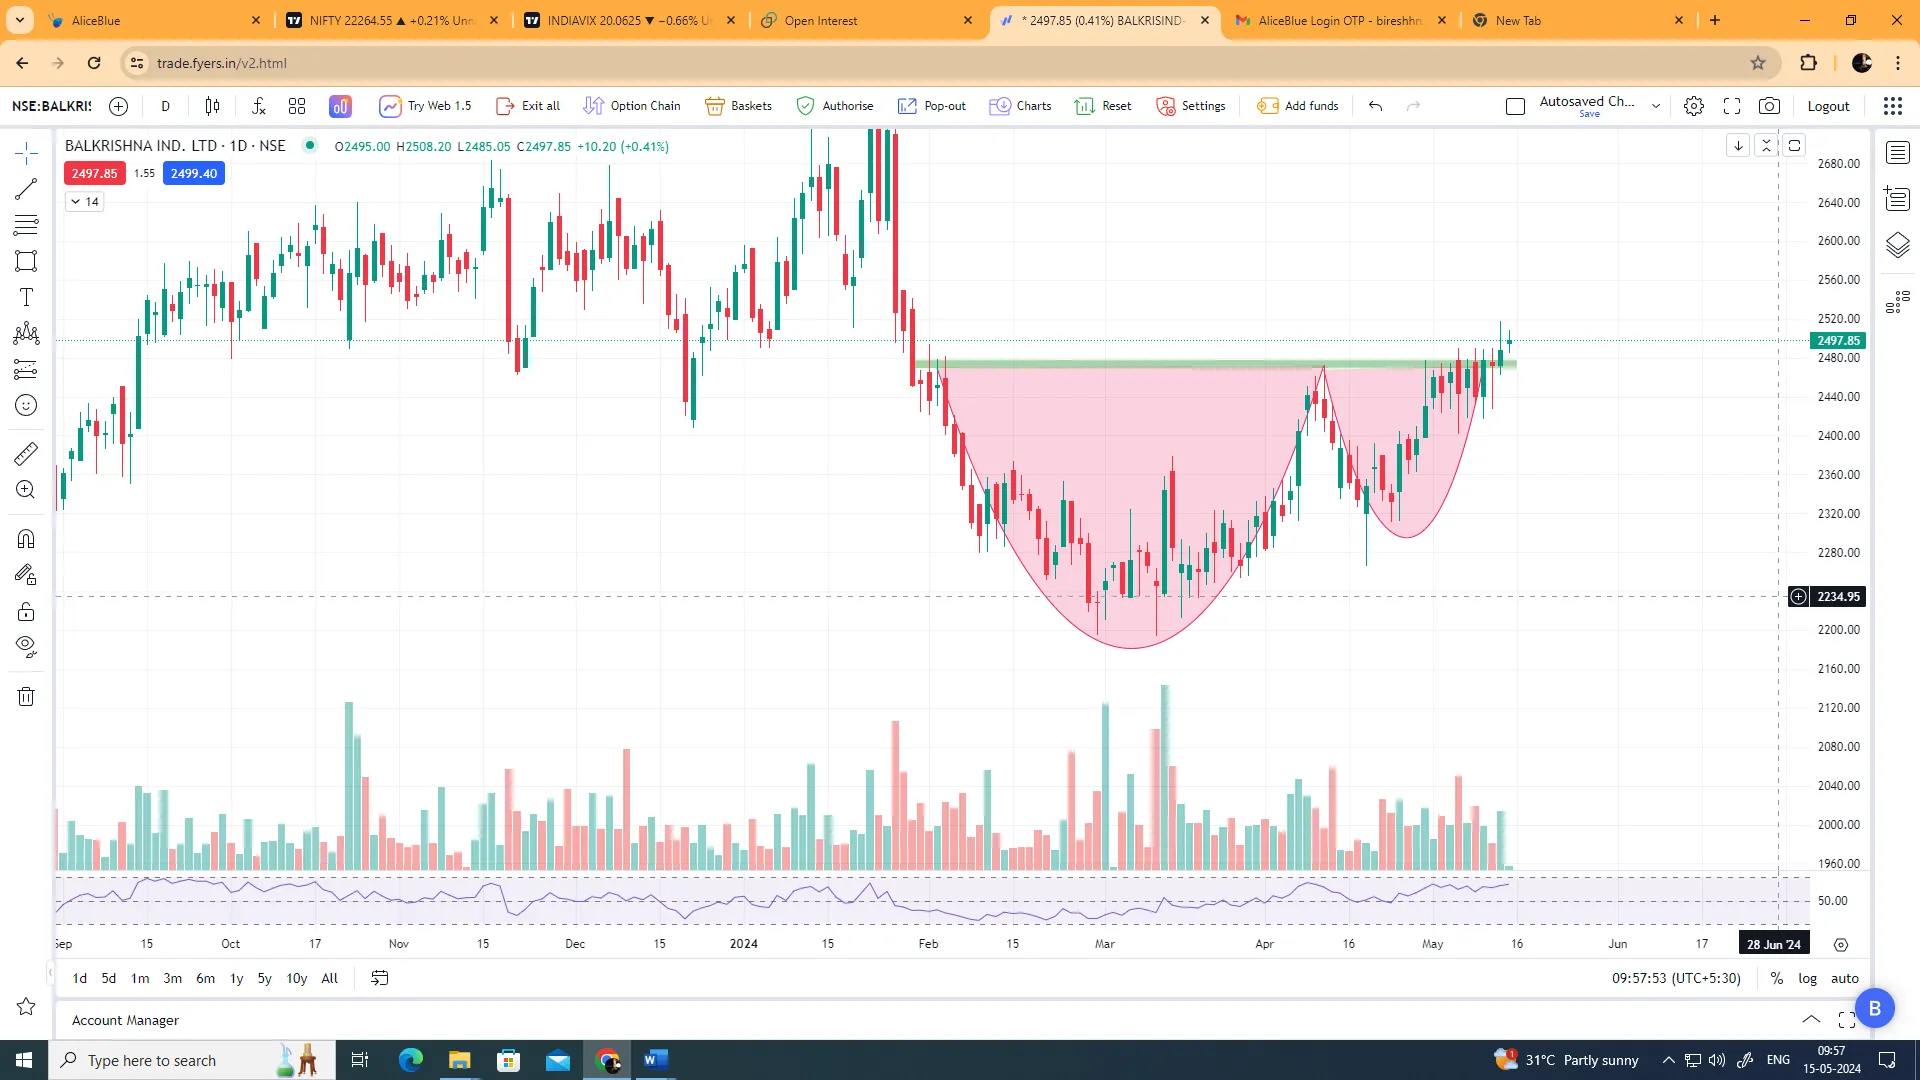
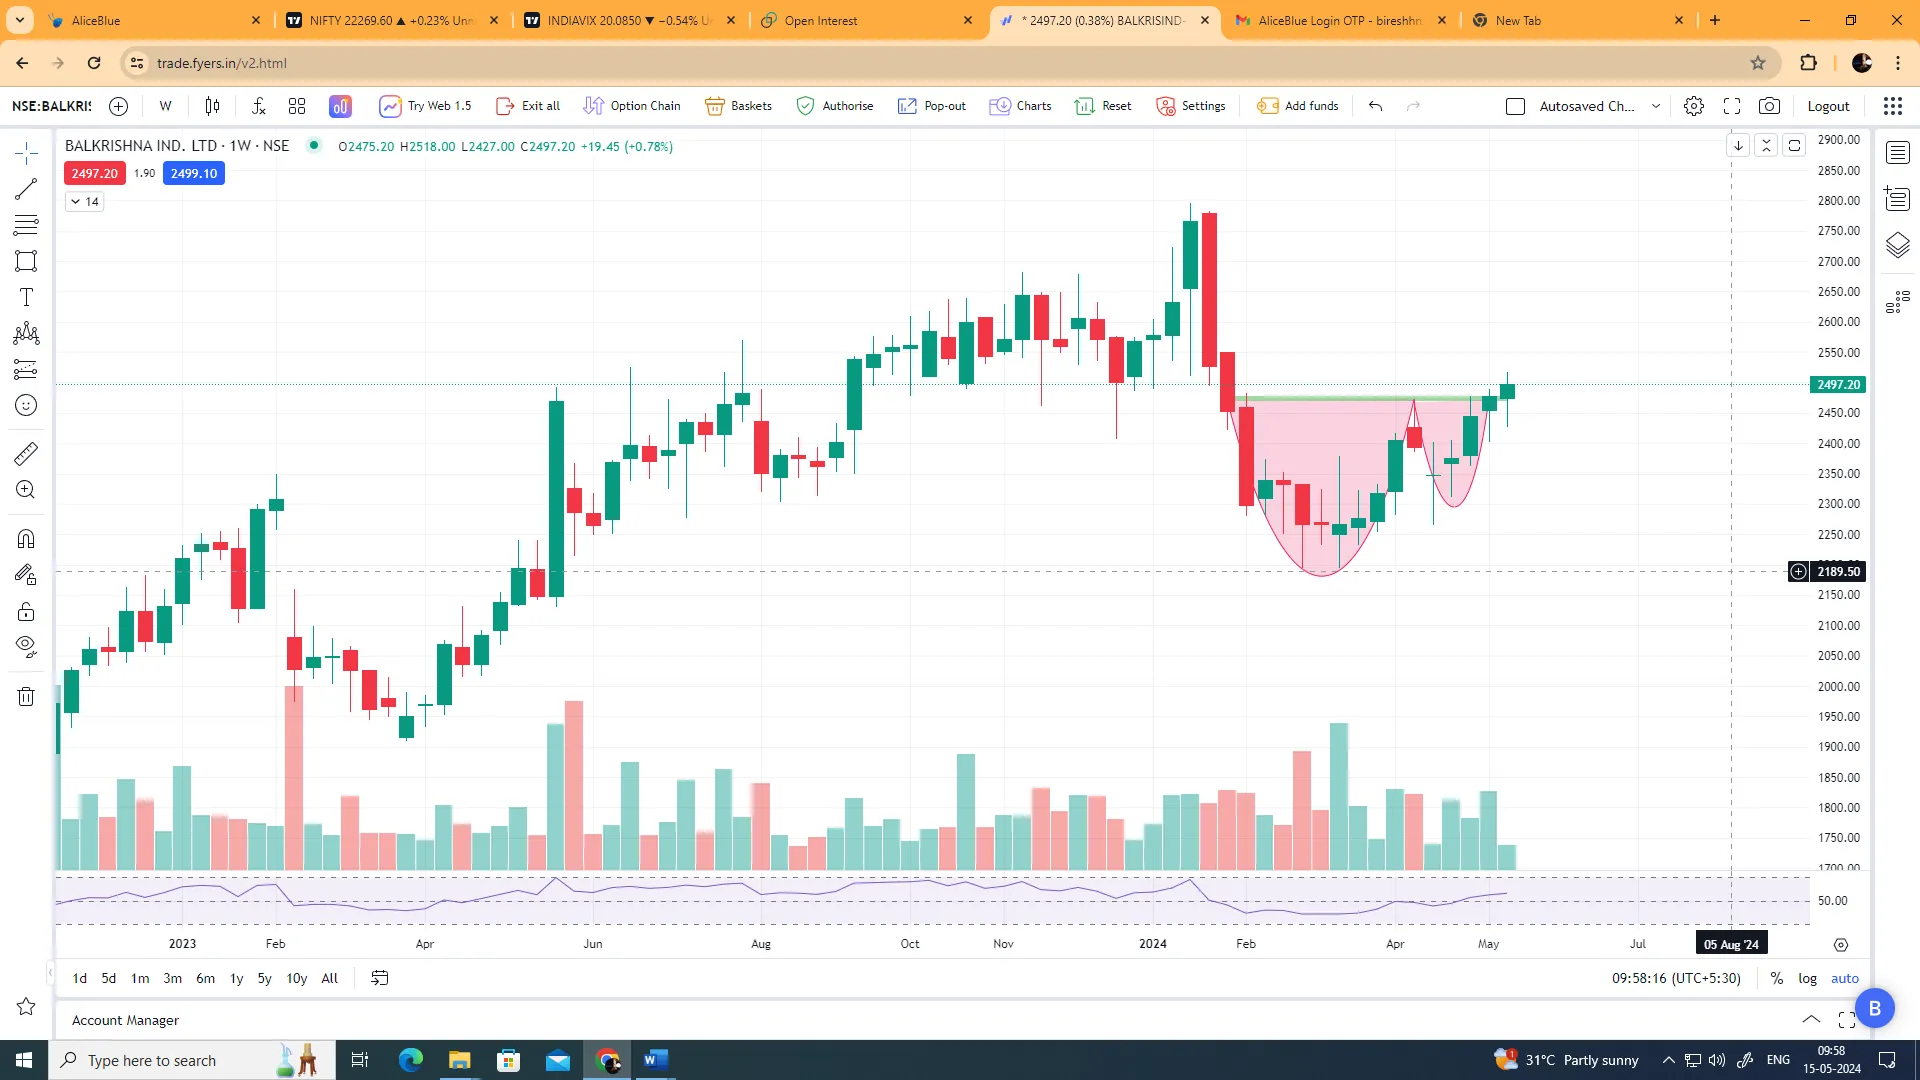
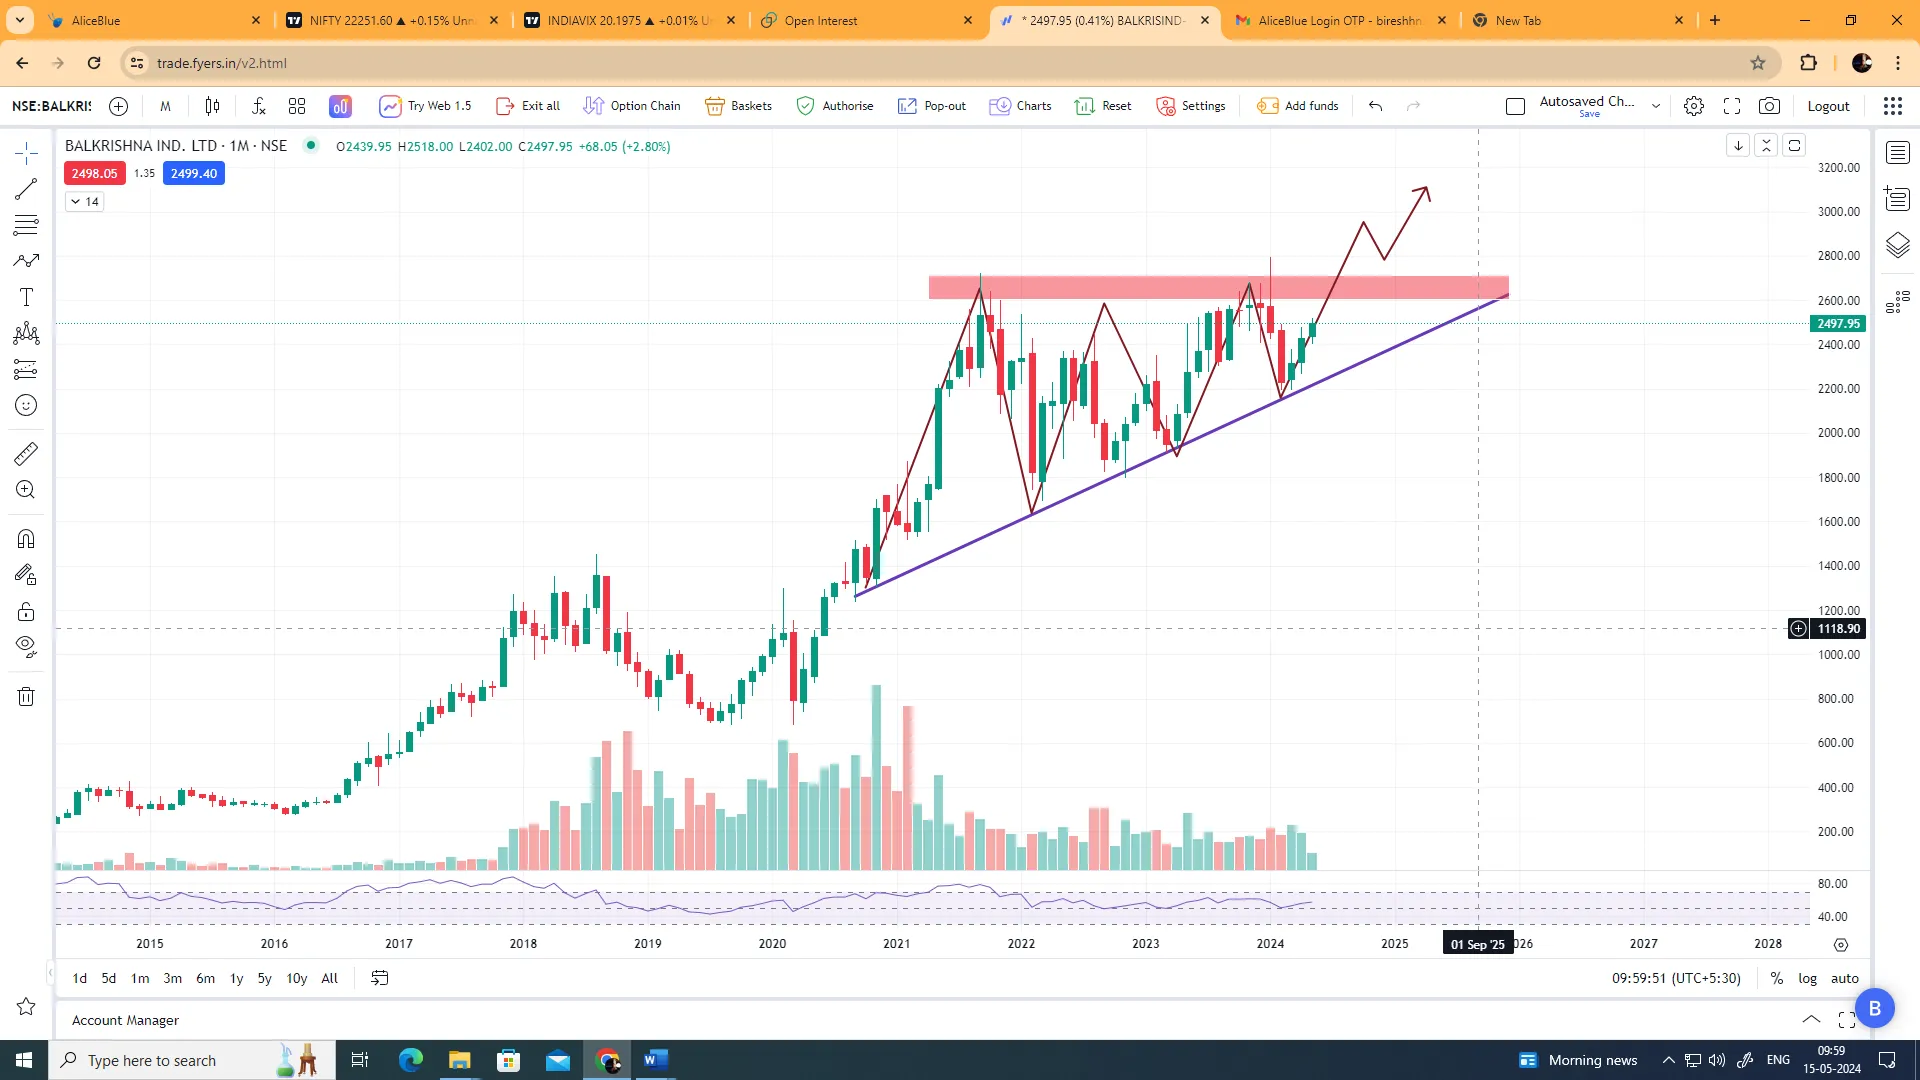
Candlestick | Doji Candlestick Pattern | Strong Bullish Continuous Candlestick pattern | Strong Bullish Continuous Candlestick pattern |
Chart Pattern | Cup and Handle Pattern | Cup and Handle Pattern | Ascending Triangle Pattern
|
Price Support Level | 2420-2440 | 2270-2300 | 1940-2000 |
Price Level | 2134 is Current Balkrishna Industries share price | 52 weeks High 2795.50 | 52 weeks low 2130.10 |
As of 15th May 2024, the price action and price levels of Balkrishna Industries share price provide valuable insights into the current market sentiment and potential future trends. Let’s delve into the analysis of each aspect across different timeframes.
Price Levels
The current share price of 2134 suggests the present value of Balkrishna Industries’ stock. With the share price ready for a new high, investors may anticipate further upward movement in the stock price.
The 52-week high of 2795.50 represents the highest price level Balkrishna Industries share price has reached over the past year, indicating strong market sentiment and potential for future growth.
The 52-week low of 2130.10 reflects the lowest price level observed for Balkrishna Industries share price over the past year, providing a reference point for assessing the stock’s price volatility.

Daily Timeframe
Candlestick Pattern:
A Doji Candlestick Pattern has formed, indicating indecision in the market. After a breakout of 2480, Balkrishna Industries share price is holding above resistance, with a possibility of reaching 2800 in the short term.
Chart Pattern:
The Cup and Handle Pattern has been activated on the daily timeframe, indicating a potential bullish reversal after a correction of approximately 22% from the previous high. This pattern suggests that the Balkrishna Industries share price may experience an upward movement, potentially driving the market in an upward direction.
Price Support Levels:
For the short term, the support range is between 2420-2440, providing a level where buying interest may emerge, supporting the share price during potential pullbacks.

Weekly Timeframe
Candlestick Pattern:
A Strong Bullish Continuous Candlestick pattern is evident, with Balkrishna Industries share price breaking 2480. It is currently moving upward from 2200, suggesting bullish momentum and potential for further gains.
Chart Pattern:
The Cup and Handle Pattern is also activated on the weekly timeframe, with Balkrishna Industries share price breaking above a resistance trendline and sustaining its position above it. This suggests a strong bullish sentiment, indicating that the share price may easily move towards its all-time high level, reflecting positive market sentiment and investor confidence.
Price Support Levels:
In the medium term, the support range is between 2270-2300, indicating a stronger support level that may influence market sentiment and price direction.

Monthly Timeframe
Candlestick Pattern:
A Strong Bullish Continuous Candlestick pattern is forming, with Balkrishna Industries share price making Higher Lows from around 1315. There is a high probability of creating a new high within the next quarter, indicating sustained upward momentum.
Chart Pattern:
An Ascending Triangle Pattern is observed on the monthly timeframe, characterized by continuous support levels. This pattern suggests a bullish continuation, with minimal chances of the share price dropping below the 2200 level. This indicates a strong support level and potential for further upward movement in Balkrishna Industries share price.
Price Support Levels:
In a serious case scenario, the support range is between 1940-2000, highlighting a critical level where significant buying pressure may be expected to prevent further downside movement in Balkrishna Industries’ share price.
In summary, the analysis of price action and price levels suggests a bullish outlook for Balkrishna Industries share price, with multiple technical indicators and patterns signalling potential upward momentum and new highs in the future. However, investors should conduct thorough analysis and consider risk management strategies before making investment decisions.
Indicators Use for Technical Analysis
Bolinger Band (BB):
Bolinger Band Price level in Balkrishna Industries share price (As of 15th May 2024) | |||
| Upper Band | Median | Lower Band |
Bolinger Band | 2527.83 | 2416.87 | 2305.92 |
The Upper Band of the Bolinger Band is at 2527.83, indicating that Balkrishna Industries share price is near this upper threshold. This suggests that the share price is trading at a relatively high level compared to historical price movements. Investors may interpret this as a signal of potential overbought conditions or an indication of strong upward momentum.
The Median of the Bolinger Band is at 2416.87, showing strong support for Balkrishna Industries share price. This indicates that the share price is currently hovering around the middle of the Bolinger Band range. This level may act as a significant support level, with potential buying interest emerging to support the share price from declining further.
The Lower Band of the Bolinger Band is at 2305.92, representing a medium-term support level for Balkrishna Industries share price. This suggests that the share price has a higher likelihood of finding support around this level in the medium term. Investors may view this as a potential entry point for long-term positions or as an indication of potential buying opportunities.
Moving Average (MA):
Moving Average price level in daily candlestick of Balkrishna Industries share price (As of 15th May 2024) | ||
Moving Average | 100 Day | 200 Day |
Simple Moving Average (SMA) | 2411.79 | 2460 |
Exponential Moving Average (EMA) | 2406.46 | 2400 |
Simple Moving Average (SMA):
The 100-day Simple Moving Average (SMA) is at 2411.79, indicating strong support in the daily timeframe for Balkrishna Industries share price. This suggests that the share price has consistently trended above this level over the past 100 days, potentially acting as a significant support level for investors.
The 200-day Simple Moving Average (SMA) stands at 2460, suggesting a breakout position in the daily timeframe. This indicates that the share price is currently trading above its 200-day moving average, which may signal a bullish trend or positive sentiment among investors.
Exponential Moving Average (EMA):
The 100-day Exponential Moving Average (EMA) is at 2406.46, indicating strong support in the daily timeframe for Balkrishna Industries share price. Similar to the SMA, the EMA serves as a technical indicator of the share price trend, with this level representing a significant support level in the short term.
The 200-day Exponential Moving Average (EMA) is at 2400, suggesting short-term support for Balkrishna Industries share price. This level may act as a support zone for the share price, potentially attracting buying interest and preventing further decline.
In summary, the interpretation of the moving average price levels suggests that Balkrishna Industries share price is currently supported by both the SMA and EMA in the daily timeframe. The SMA at 2411.79 and the EMA at 2406.46 serve as strong support levels, while the breakout position indicated by the 200-day SMA at 2460 and the short-term support provided by the 200-day EMA at 2400 further add to the positive sentiment surrounding the share price. Investors may consider these moving average levels as important reference points when making trading decisions.
Data Analysis
Open Interest Put Call Ratio of Balkrishna Industries Ltd
Expiry Date | Put Open Interest | Call Open Interest | PCR OI | Signal |
30/05/2024 | 348.00 K | 775.50 K | 0.449 | Bullish |
27/06/2024 | 59.70 K | 411.30 K | 0.145 | Strong Bullish |
The Open Interest Put Call Ratio (PCR OI) for Balkrishna Industries Ltd. reflects market sentiment. With a PCR OI of 0.449 on 30/05/2024, a bullish sentiment prevails as call contracts outnumber put contracts. On 27/06/2024, the PCR OI drops to 0.145, indicating a strong bullish sentiment, with a significant bias towards call options. The declining PCR OI from the first to the second expiry date suggests increasing bullishness over time, potentially driving upward momentum in Balkrishna Industries’ share price. Investors may use these PCR OI levels to gauge market sentiment and make informed trading decisions.
Volume Put Call Ratio of Balkrishna Industries Ltd
Expiry Date | Put Total Contracts | Call Total Contracts | PCR Volume | Signal |
30/05/2024 | 1410.00 | 6645.00 | 0.212 | Strong Bullish |
27/06/2024 | 202.00 | 303.00 | 0.667 | Neutral |
The Volume Put Call Ratio (PCR Volume) for Balkrishna Industries Ltd. indicates market sentiment based on trading volumes of put and call contracts. With a PCR Volume of 0.212 on 30/05/2024, a strong bullish sentiment is observed, with a higher volume of call contracts traded. Conversely, on 27/06/2024, the PCR Volume of 0.667 reflects a neutral sentiment, indicating a balanced volume of put and call contracts traded. Investors can use these PCR Volume levels to gauge market sentiment and make informed trading decisions.
Conclusion
Considering the comprehensive analysis of Balkrishna Industries Ltd., we strongly advise a cautious yet optimistic investment approach. Despite facing challenges in profitability and liquidity ratios, Balkrishna Industries has demonstrated resilience and growth potential. With a diverse product portfolio, strategic partnerships with heavy equipment manufacturers, and a strong foothold in key markets, the company is well-positioned for long-term success.
Technical analysis reveals promising trends in price action, chart patterns, and support levels across different timeframes, indicating bullish momentum and potential upward movement in the share price. Additionally, indicators such as the Bolinger Band and Moving Averages further support the positive outlook for Balkrishna Industries’ shares.
Moreover, the Open Interest Put Call Ratio and Volume Put Call Ratio reflect favourable market sentiment, with indications of bullishness and strong buying interest in call options. Overall, while acknowledging challenges, the analysis suggests a favourable investment opportunity in Balkrishna Industries, urging investors to consider accumulating positions in the company’s shares.
FAQs
- What is Balkrishna Industries Limited?
Balkrishna Industries Limited (BKT) is an Indian multinational tire manufacturing company based in Mumbai, India. It specializes in off-highway tires used in various sectors such as mining, agriculture, and gardening.
- When was Balkrishna Industries Limited founded?
Balkrishna Industries Limited was incorporated on 20th November 1961.
- Where are Balkrishna Industries’ manufacturing facilities located?
Balkrishna Industries operates five manufacturing facilities in Aurangabad, Bhiwadi, Chopanki, Dombivali, and Bhuj.
- Which indices is Balkrishna Industries listed on?
Balkrishna Industries is listed on the National Stock Exchange (NSE) and the Bombay Stock Exchange (BSE).
- What is the market share of Balkrishna Industries in the global off-the-road tire segment?
In 2014, Balkrishna Industries held an 8% market share in the global off-the-road tire segment.
- Where is Balkrishna Industries’ North American office located?
Balkrishna Industries’ North American office is located in Akron, Ohio, with a warehouse in Wando, South Carolina.
- What is the current shareholding pattern of Balkrishna Industries?
The current shareholding pattern includes Promoter Shareholding (58.29%), FII (Foreign Institutional Investor) Shareholding (12.24%), DII (Domestic Institutional Investor) Shareholding (7.45%), MF (Mutual Fund) Shareholding (14.63%), and Retail and Others (7.39%).
- What are the key profitability ratios of Balkrishna Industries?
Key profitability ratios include Gross Profit Margin, Net Profit Margin, and Return on Equity (ROE).
- Which technical analysis indicators suggest a bullish outlook for Balkrishna Industries’ share price?
Technical indicators such as candlestick patterns, chart patterns like Cup and Handle and Ascending Triangle, and moving averages indicate bullish momentum in Balkrishna Industries’ share price.
- What factors influence the Open Interest Put Call Ratio and Volume Put Call Ratio of Balkrishna Industries?
The Open Interest Put Call Ratio and Volume Put Call Ratio are influenced by market sentiment, trading volumes of put and call contracts, and investors’ outlook on the company’s performance and future prospects.

