Stay updated with the latest analysis of Persistent Systems Share Price. Discover key support and resistance levels, moving averages, and RSI insights to make informed investment decisions.

Persistent Systems, an Indian multinational tech firm, excels in cloud computing, IoT, endpoint security, big data analytics, and software engineering. Founded in 1990 by Anand Deshpande, it’s listed on the NSE and BSE since March 2010. The Persistent Systems share price is a key indicator of its financial health and market position. Investors closely watch the Persistent Systems share price to assess the company’s performance and future potential. Influenced by strategic acquisitions, innovative services, and steady growth, the Persistent Systems share price helps investors make informed decisions by reflecting financial results, industry trends, and market conditions.
Table of Contents
Persistent Systems, based in Pune, India, is a multinational technology services company specializing in cloud computing, Internet of Things (IoT), endpoint security, big data analytics, and software product engineering. Anand Deshpande, a former Hewlett-Packard employee, founded the company in 1990 with an initial investment of $21,000. Significant milestones include Intel Capital’s $1 million investment for a 3.5% stake in 2000 and a $18.8 million raise from Norwest Venture Partners and Gabriel Venture Partners in 2005.
In March 2010, Persistent Systems went public, listing on both the National Stock Exchange of India and the Bombay Stock Exchange. The company has grown through various strategic acquisitions. In February 2011, it took over Nagpur-based Infospectrum India, followed by acquiring Openwave’s location business in 2012. In 2015, Persistent acquired the digital content management solutions business of US-based Akumina.
The year 2016 saw multiple expansions: Accelerite, Persistent’s product arm, acquired Citrix’s CloudPlatform and CloudPortal Business Manager; it also acquired PRM Cloud Solutions, a Salesforce consulting partner, and launched specialized engineering services for the IBM Watson IoT platform. Persistent continued its growth by acquiring the Swiss company Parx Werk in 2017 and joining Siemens’ MindSphere partner program in 2019 to deliver industrial IoT services. In the same year, it acquired Youperience, a Salesforce implementation company, and in 2020, the US-based enterprise software firm Capiot Software.
Persistent’s 2021 acquisitions included cloud migration company Sureline Systems, Software Corporation International (SCI) and its affiliate Fusion360 for $53 million, and New Jersey-based IT and cloud management company Shree Partners. In 2022, Persistent further expanded by acquiring the American consulting firm Data Glove for $90.5 million and the cloud computing services company MediaAgility for $71.71 million.

Subsidiaries of Persistent Systems Ltd.
NAME OF THE SUBSIDIARY COMPANY | REGISTERED IN | HOLDING PERCENTAGE |
Persistent Systems Inc. | USA | 100% |
Persistent Systems Pte. Ltd. | Singapore | 100% |
Persistent Systems France S.A.S. | France | 100% |
Persistent Systems Malaysia Sdn. Bhd. | Malaysia | 100% |
Persistent Systems Germany GmbH | Germany | 100% |
Persistent Telecom Solutions Inc. | USA | 100% |
Akshat Corporation (dba R-Gen Solutions) | USA | 100% |
Aepona Holdings Limited | Ireland | 100% |
Aepona Group Limited | Ireland | 100% |
Valista Limited | Ireland | 100% |
Aepona Limited | UK | 100% |
Persistent Systems Lanka (Private) Limited | Sri Lanka | 100% |
Persistent Systems Israel Limited | Israel | 100% |
Persistent Systems Mexico S.A. de C.V. | Mexico | 100% |
Share Holding Pattern of Persistent Systems Ltd.
These figures represent significant actions taken by a company that directly influence shareholder value. They signify material changes within the company and have an impact on its stakeholders:
- Promoter Shareholding: 31.02%
- FII (Foreign Institutional Investor) Shareholding: 24.96%
- DII (Domestic Institutional Investor) Shareholding: 4.87%
- MF (Mutual Fund) Shareholding: 21.01%
- Retail and Others: 18.14%
Analysing the financial health of Persistent Systems Ltd. provides insights into its profitability, liquidity, solvency, efficiency, and valuation. This fundamental analysis covers key ratios from March 2021 to March 2024, highlighting the company’s strengths and areas for improvement for potential investors.
Fundamental Analysis of Persistent Systems Ltd | ||||
Ratio | March 2024 | March 2023 | March 2022 | March 2021 |
Profitability Ratio | ||||
Gross Profit Margin | 27.61% | 40.49% | 41.67% | 40.31% |
Net Profit Margin | 11.13% | 11.03% | 12.09% | 10.76% |
Return on Equity (ROE) | 22.06% | 23.23% | 20.50% | 16.12% |
Liquidity Ratio | ||||
Current Ratio | 1.91 | 1.80 | 1.99 | 3.47 |
Quick Ratio (Acid-Test Ratio) | 1.91 | 1.89 | 0 | 0 |
Solvency Ratio | ||||
Debt to Equity Ratio | 0.0418 | 0.125 | 0.128 | 0.0096 |
Interest Coverage Ratio | 8.58 | 27.21 | 79.06 | 106.26 |
Efficient Ratio | ||||
Inventory Turnover Ratio | -75.65 | -52.88 | 0 | 0 |
Account Receivable Turnover Ratio | 6.05 | 5.32 | 4.53 | 3.91 |
Valuation Ratio | ||||
Price to earning Ratio (P/E) | 60.62 | 38.51 | 39.27 | 46.77 |
Price to Book Ratio (P/B) | 15.07 | 9.30 | 6.76 | 7.26 |
Growth Ratio | ||||
Earning per Share (EPS) Growth | 55.00 | 37.23 | 52.75 | 32.59 |
Revenue Growth | 6,678.70 | 5,191.42 | 3,707.94 | 2,597.22 |
Profitability Ratios
Gross Profit Margin:
Over the four-year period, Persistent Systems Ltd. experienced a significant decline in its gross profit margin. In March 2021, the gross profit margin stood at 40.31%, which slightly increased to 41.67% in March 2022. However, by March 2023, it had dropped to 40.49%, and further plummeted to 27.61% in March 2024. This sharp decline suggests increasing costs or pricing pressures, potentially impacting the company’s profitability from its core operations.
Net Profit Margin:
Despite the fluctuations in gross profit margin, the net profit margin of Persistent Systems Ltd. has remained relatively stable. It was 10.76% in March 2021, rose to 12.09% in March 2022, and slightly decreased to 11.03% in March 2023, then marginally increased to 11.13% in March 2024. This stability indicates effective cost management and operational efficiencies, which helped in maintaining a consistent profit level.
Return on Equity (ROE):
The ROE indicates how effectively the company is using its equity to generate profits. In March 2021, the ROE was 16.12%, which increased to 20.50% in March 2022 and 23.23% in March 2023, before slightly declining to 22.06% in March 2024. The overall upward trend reflects the company’s efficient use of shareholders’ funds, although the slight drop in the last year warrants further analysis.
Liquidity Ratios
Current Ratio:
The current ratio, which measures the company’s ability to pay short-term obligations, was 3.47 in March 2021, indicating a strong liquidity position. However, it decreased to 1.99 in March 2022 and 1.80 in March 2023, before improving slightly to 1.91 in March 2024. While still above 1, the declining trend suggests a reduction in liquidity over the years.
Quick Ratio (Acid-Test Ratio):
This ratio, which is a stricter measure of liquidity, was 1.89 in March 2023 and slightly increased to 1.91 in March 2024. The absence of data for the previous years indicates either a lack of inventory or a recent emphasis on this metric. A ratio above 1 suggests that the company can cover its immediate liabilities without relying on inventory sales.
Solvency Ratios
Debt to Equity Ratio:
This ratio indicates the proportion of debt used to finance the company’s assets relative to shareholders’ equity. Persistent Systems Ltd. had a very low debt to equity ratio of 0.0096 in March 2021, which increased to 0.128 in March 2022 and 0.125 in March 2023, before slightly reducing to 0.0418 in March 2024. Despite the fluctuations, the company maintains a relatively low level of debt, indicating a conservative approach to leveraging.
Interest Coverage Ratio:
This ratio measures the company’s ability to pay interest on its debt. Persistent Systems Ltd. had an exceptionally high interest coverage ratio of 106.26 in March 2021, which drastically decreased to 79.06 in March 2022, 27.21 in March 2023, and further down to 8.58 in March 2024. The significant decline suggests increasing interest expenses or decreasing earnings, which could be a red flag for long-term solvency.
Efficiency Ratios
Inventory Turnover Ratio:
The negative values in this ratio for March 2022 and March 2023, and the absence of data in other years, indicate an anomaly or a potential accounting adjustment. It’s critical to investigate further to understand these figures.
Account Receivable Turnover Ratio:
This ratio shows how effectively the company collects its receivables. It has improved steadily from 3.91 in March 2021 to 4.53 in March 2022, 5.32 in March 2023, and 6.05 in March 2024. This consistent improvement indicates better credit management and efficient collection practices.
Valuation Ratios
Price to Earnings Ratio (P/E):
The P/E ratio, which indicates market expectations of future earnings growth, was 46.77 in March 2021. It decreased slightly to 39.27 in March 2022 and 38.51 in March 2023, before rising sharply to 60.62 in March 2024. The high P/E ratio in 2024 suggests that investors expect significant future earnings growth, but it could also indicate overvaluation.
Price to Book Ratio (P/B):
This ratio, which compares the market value to the book value of the company, has increased from 7.26 in March 2021 to 6.76 in March 2022, 9.30 in March 2023, and 15.07 in March 2024. The rising P/B ratio indicates that investors are willing to pay a premium for the company’s stock, reflecting strong market confidence.
Growth Ratios
Earnings per Share (EPS) Growth:
The EPS growth rate has shown substantial fluctuations, from 32.59% in March 2021 to a remarkable 52.75% in March 2022, slightly reducing to 37.23% in March 2023, and surging to 55.00% in March 2024. The high growth rate in 2024 indicates robust profitability and efficient operations, contributing to increased shareholder value.
Revenue Growth:
Persistent Systems Ltd. has demonstrated strong revenue growth, from ₹2,597.22 crore in March 2021 to ₹3,707.94 crore in March 2022, ₹5,191.42 crore in March 2023, and an impressive ₹6,678.70 crore in March 2024. This consistent revenue growth showcases the company’s ability to expand its market presence and increase its sales effectively.
The fundamental analysis of Persistent Systems Ltd. reveals a mixed yet promising financial health. While there are concerns regarding the declining gross profit margin and interest coverage ratio, the company’s strong net profit margin, improving ROE, and robust revenue and EPS growth highlight its operational efficiency and growth potential. The liquidity ratios, despite their downward trend, still indicate a manageable liquidity position. Additionally, the low debt to equity ratio and improving account receivable turnover ratio reflect prudent financial management. Investors should consider these factors, alongside market conditions and industry trends, to make informed decisions regarding Persistent Systems Ltd.
Technical Analysis of Persistent Systems Share Price
Technical analysis of Persistent Systems Share Price involves evaluating price movements and trading volumes to forecast future price movements. Technical analysis depends on charts and statistical indicators. analysts use various techniques, such as trend analysis, chart patterns, and technical indicators like moving averages or relative strength index (RSI), to identify potential buying or selling opportunities for Persistent Systems Share Price. The main goal of technical analysis of Persistent Systems Share Price is to predict future price movements based on historical data and market psychology, helping investors make informed decisions about when to enter or exit trades. So, bellow we are explaining Various techniques as of 15th May 2024 for technical analysis of Persistent Systems Ltd.
Price Action
Price action and price level of Persistent Systems Share Price (As of 15th May 2024) | |||
Price action | Daily Timeframe | Weekly Timeframe | Monthly Timeframe |
Candlestick | Strong Bullish Continuous Candlestick pattern | Strong Bullish Candlestick pattern | Inside bar Candlestick is forming |
Chart Pattern | Double Bottom or “W” Pattern | Falling Wedge Pattern is forming | This is just a retracement from high |
Price Support Level | 3330-3350 | 3220-3250 | 3150-3250. |
Price Level | 3481 is Current Persistent Systems Share Price | 52 weeks High 4450 | 52 weeks low 2317.18 |
Analysing the Persistent Systems Share Price entails examining its price action and levels across various timeframes. As of May 15, 2024, the share price exhibits significant patterns and levels crucial for investors. This analysis covers daily, weekly, and monthly timeframes, highlighting candlestick patterns, chart formations, and support and resistance levels.
Price Level
The current Persistent Systems Share Price stands at 3481, with a 52-week high of 4450. This high indicates the peak price reached by the stock over the past year, reflecting its potential during favourable market conditions. The 52-week low is recorded at 2317.18, representing the lowest price attained by the stock over the past year. This level serves as a benchmark for assessing downside risk and historical volatility.

Daily Timeframe Analysis
Candlestick Pattern:
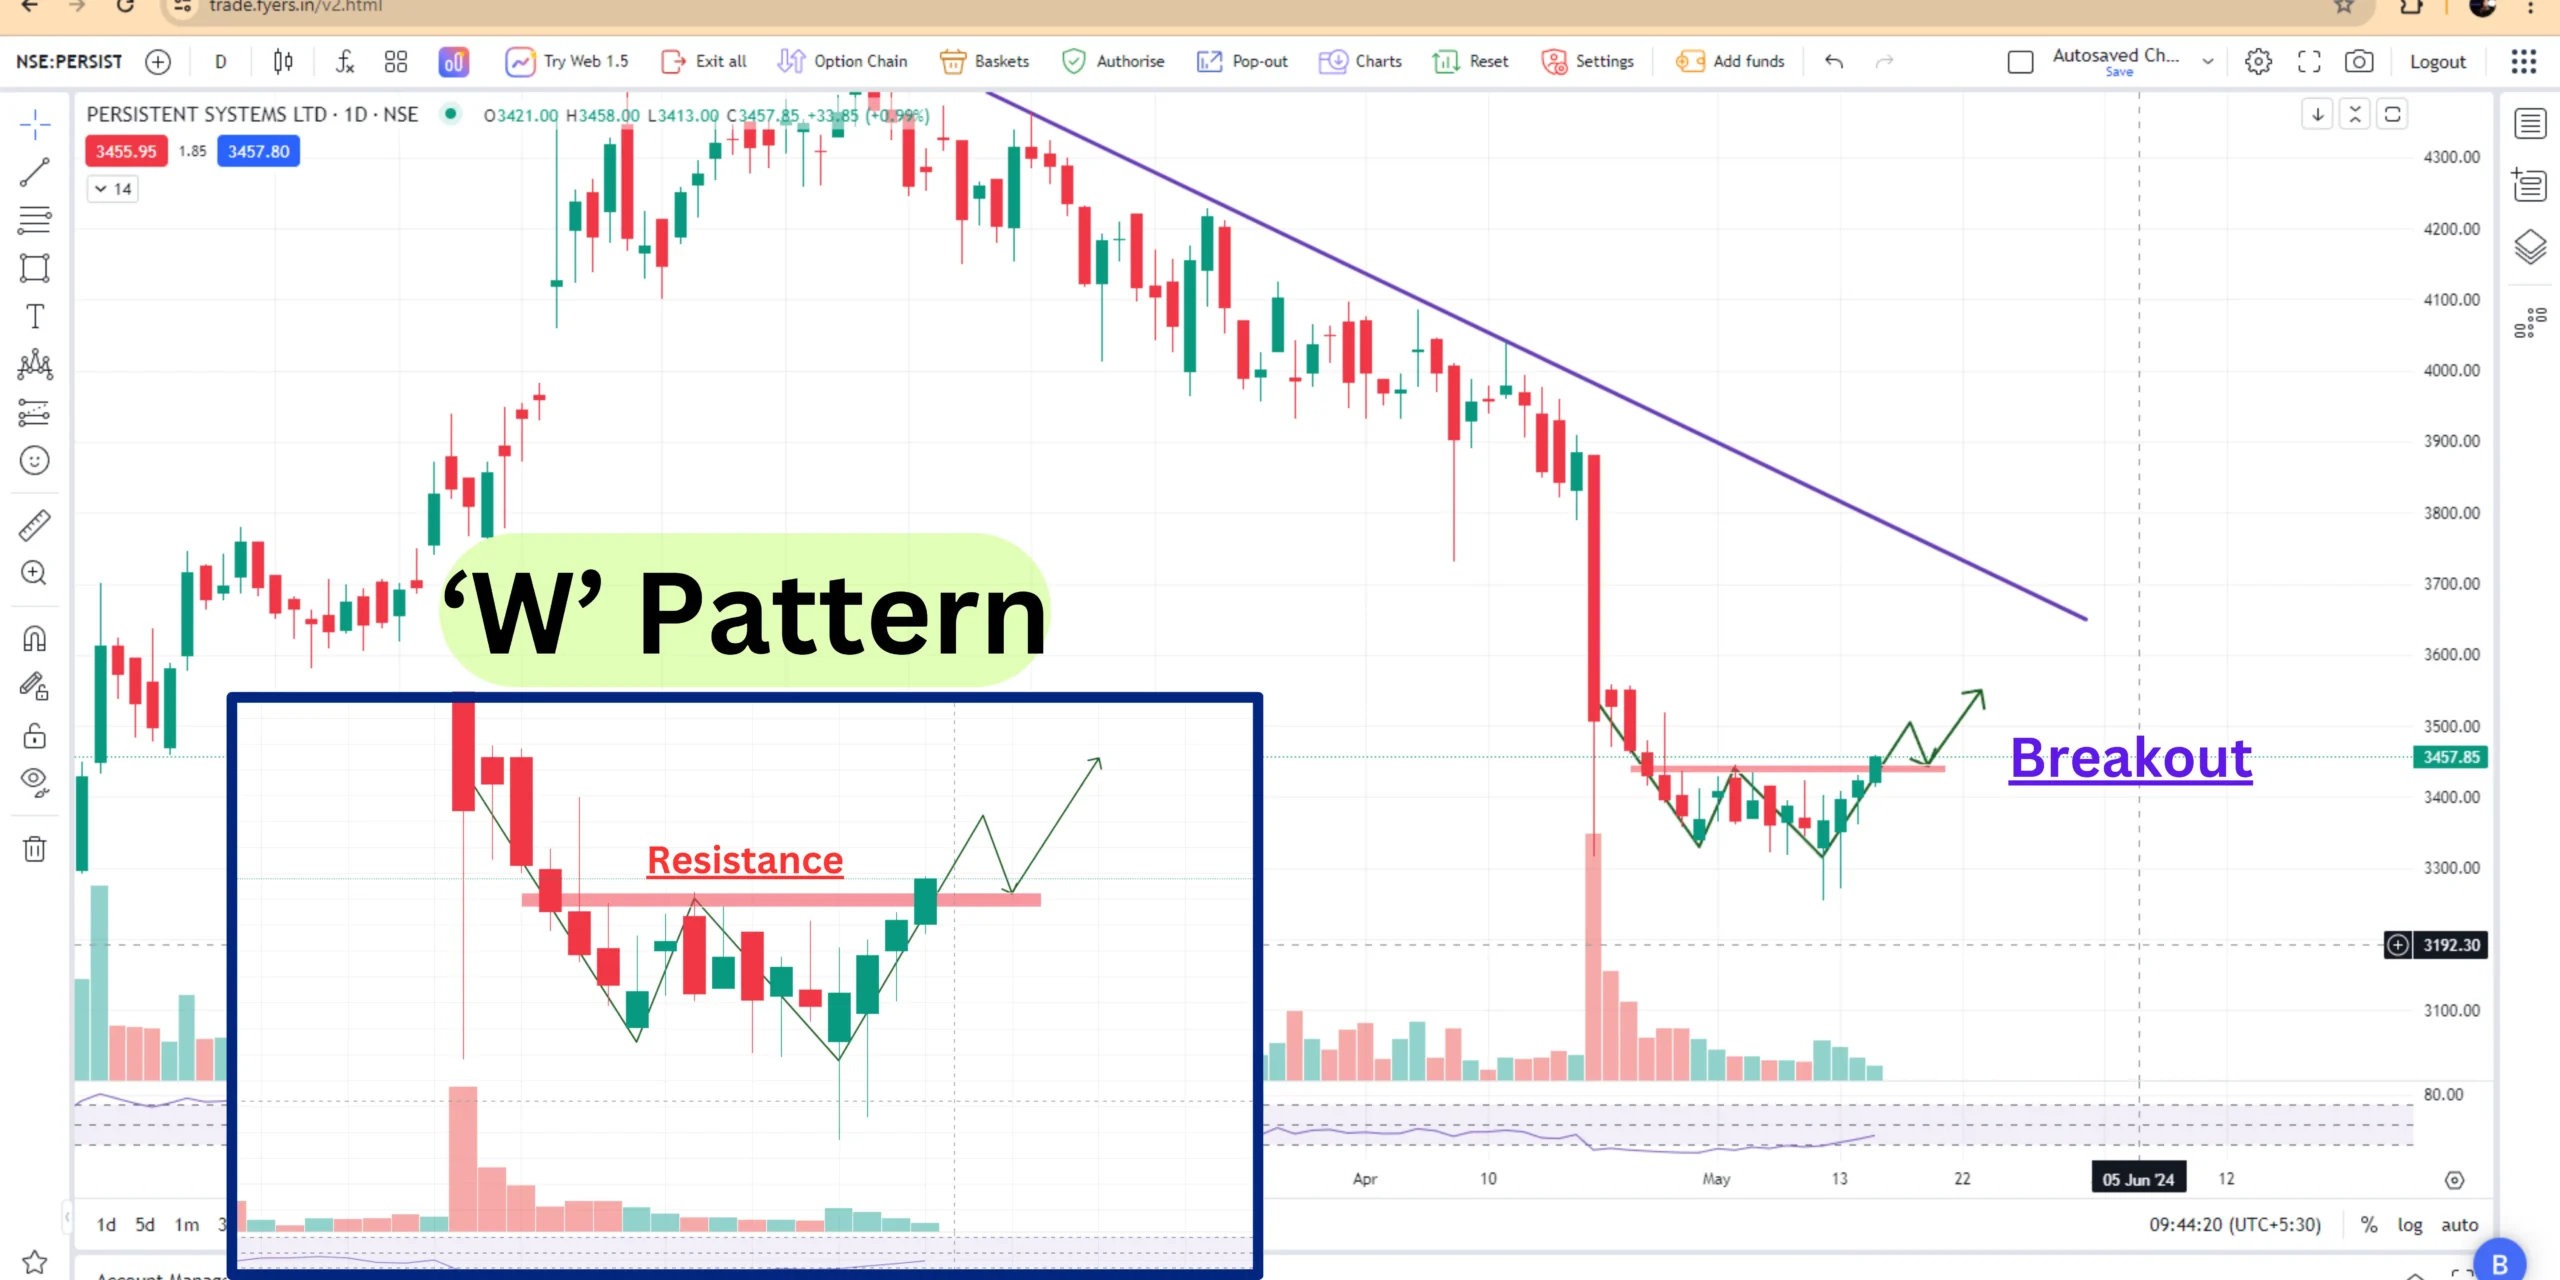
The Persistent Systems Share Price on the daily chart displays a robust bullish continuous candlestick pattern. This bullish momentum broke through the 3442 level with notable volume, signalling strong buying interest and upward momentum. The persistent bullish candlesticks indicate positive market sentiment and investor confidence in the stock’s potential for further gains.
Chart Pattern:
A double bottom or “W” pattern has emerged. Following a 26% correction, the share price rebounded from the 3254 level, suggesting a reversal of the previous downtrend. Crossing the resistance line of this pattern, the share price currently holds above the resistance, reinforcing the bullish outlook for investors.
Price Support Level:
Immediate support lies between 3330 and 3350 on the daily timeframe. This support zone acts as a safety net, where buying interest may emerge in case of price dips, bolstering the ongoing uptrend in the Persistent Systems Share Price.

Weekly Timeframe Analysis
Candlestick Pattern:
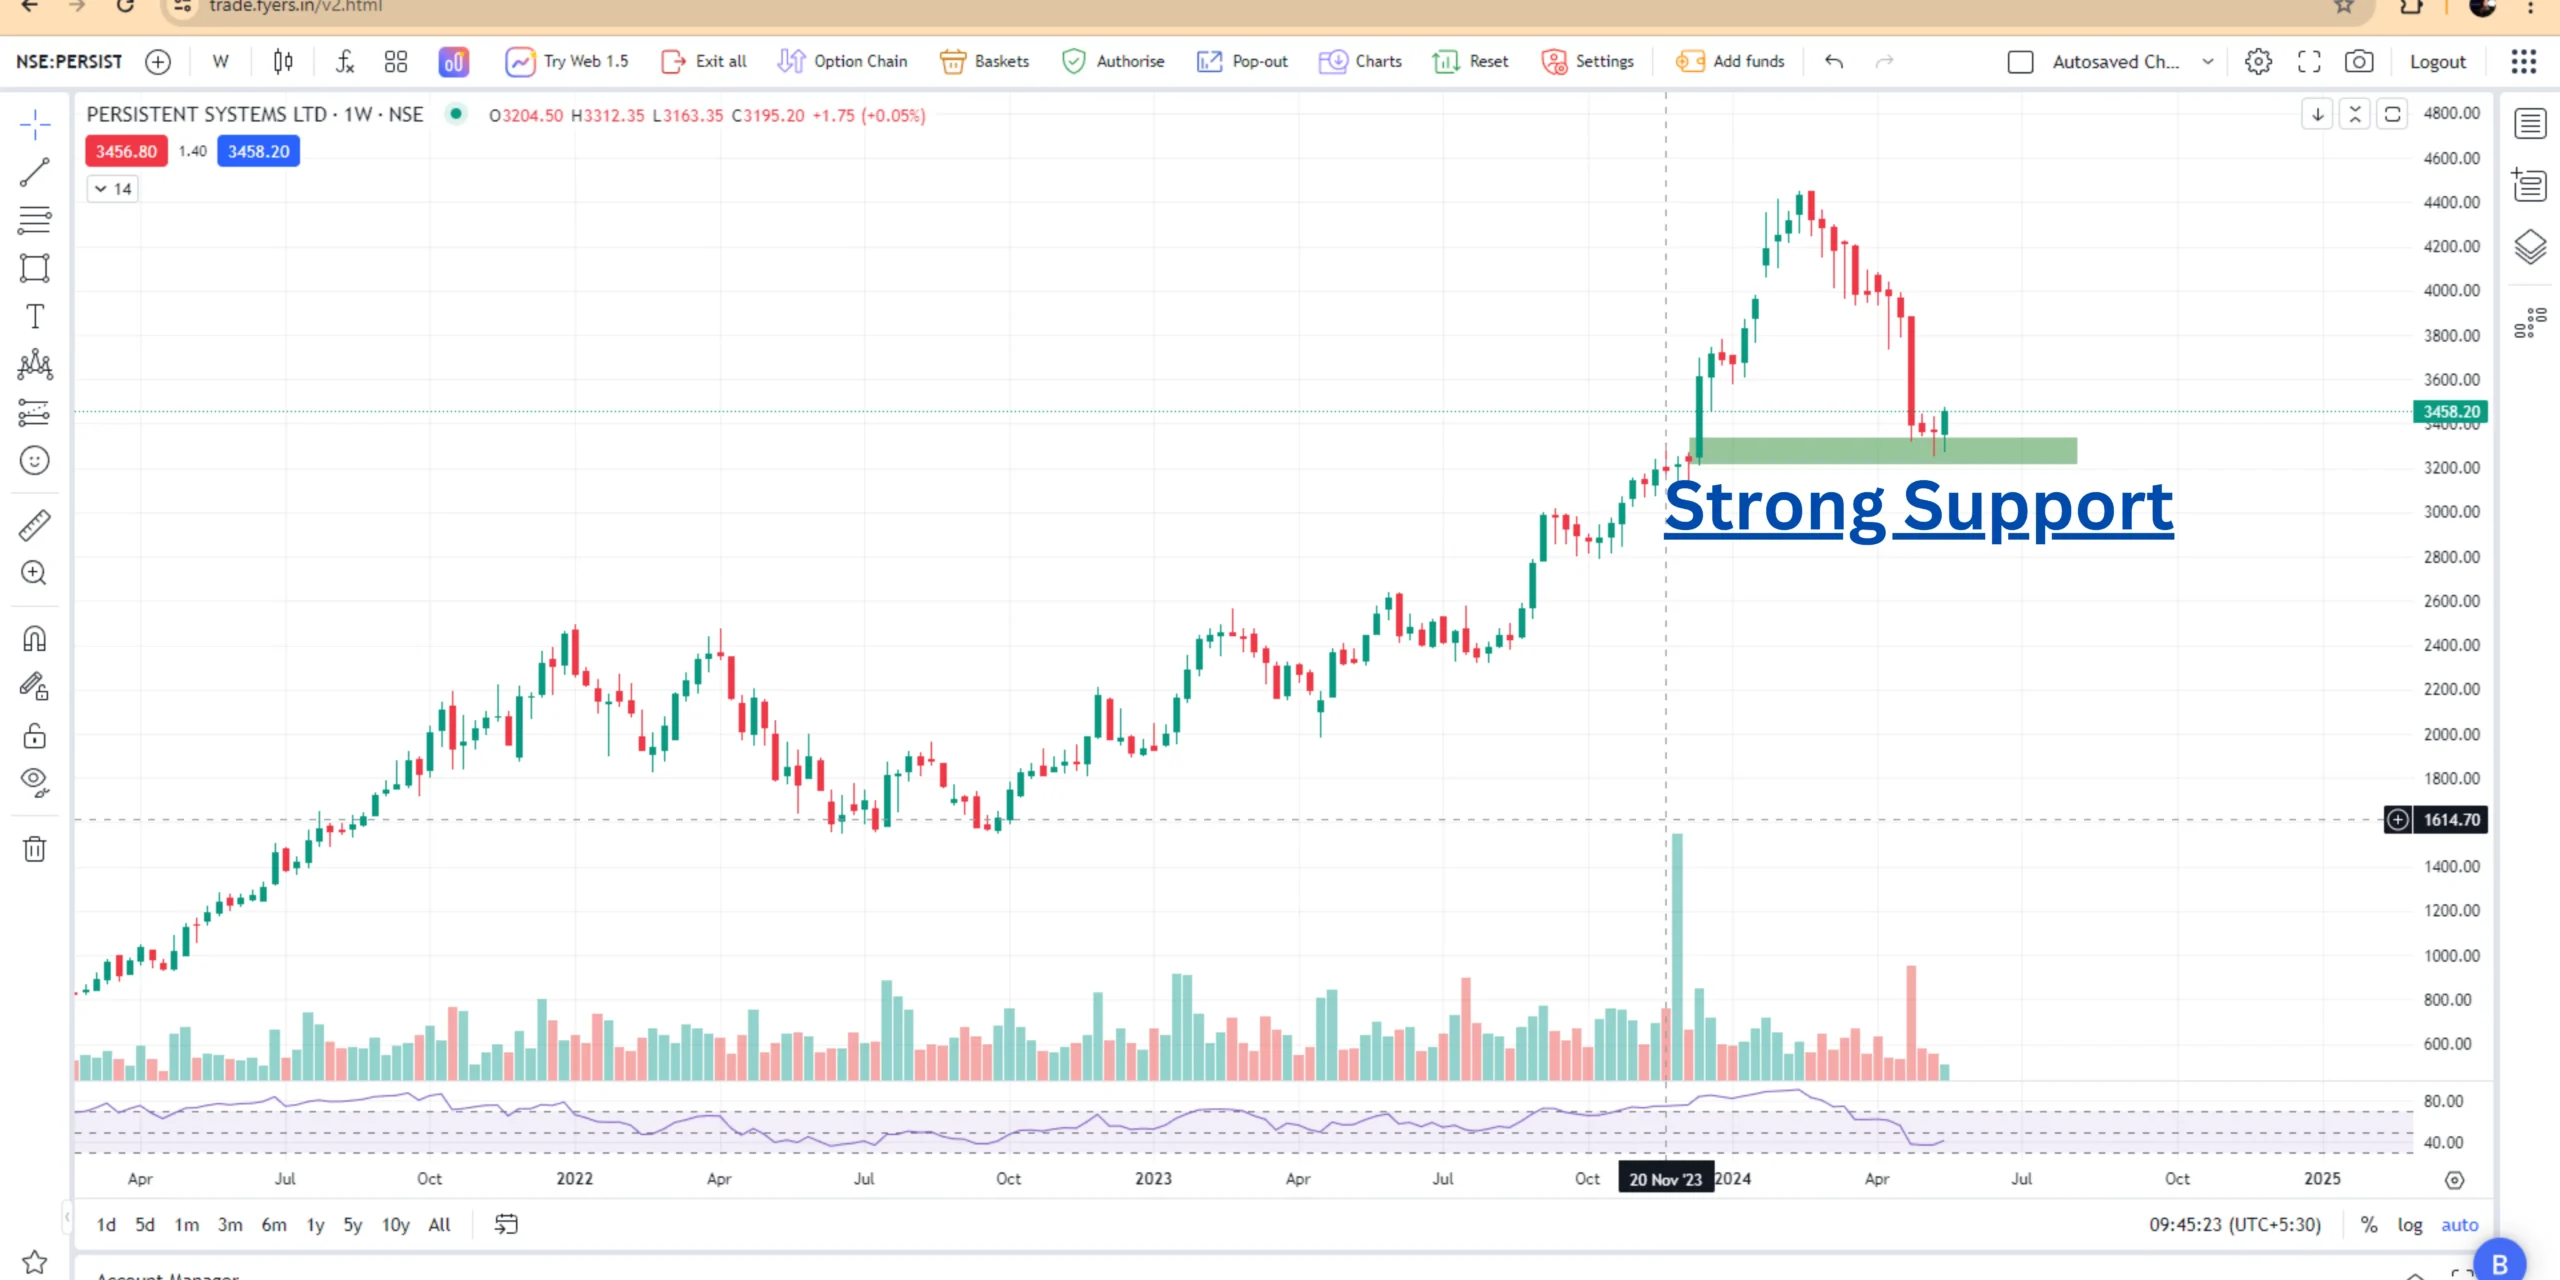
On the weekly chart, the Persistent Systems Share Price exhibits a strong bullish candlestick pattern. It finds robust support near the 3210-3250 range. Recent weeks have seen the formation of doji candles, indicating market indecision. However, these candles also suggest that the share price has established a solid base at these levels, laying the groundwork for potential upward movement.
Chart Pattern:
A falling wedge pattern is taking shape on the weekly chart. While completion of this pattern will require a close above 3800, the current bullish momentum makes achieving this target feasible. This pattern suggests a bullish outlook for the Persistent Systems Share Price in the medium term.
Price Support Level:
The weekly support range extends from 3220 to 3250, providing strong foundational support for the share price. This range has consistently prevented significant declines and enabled the stock to gather momentum for potential upward moves.

Monthly Timeframe Analysis
Candlestick Pattern:
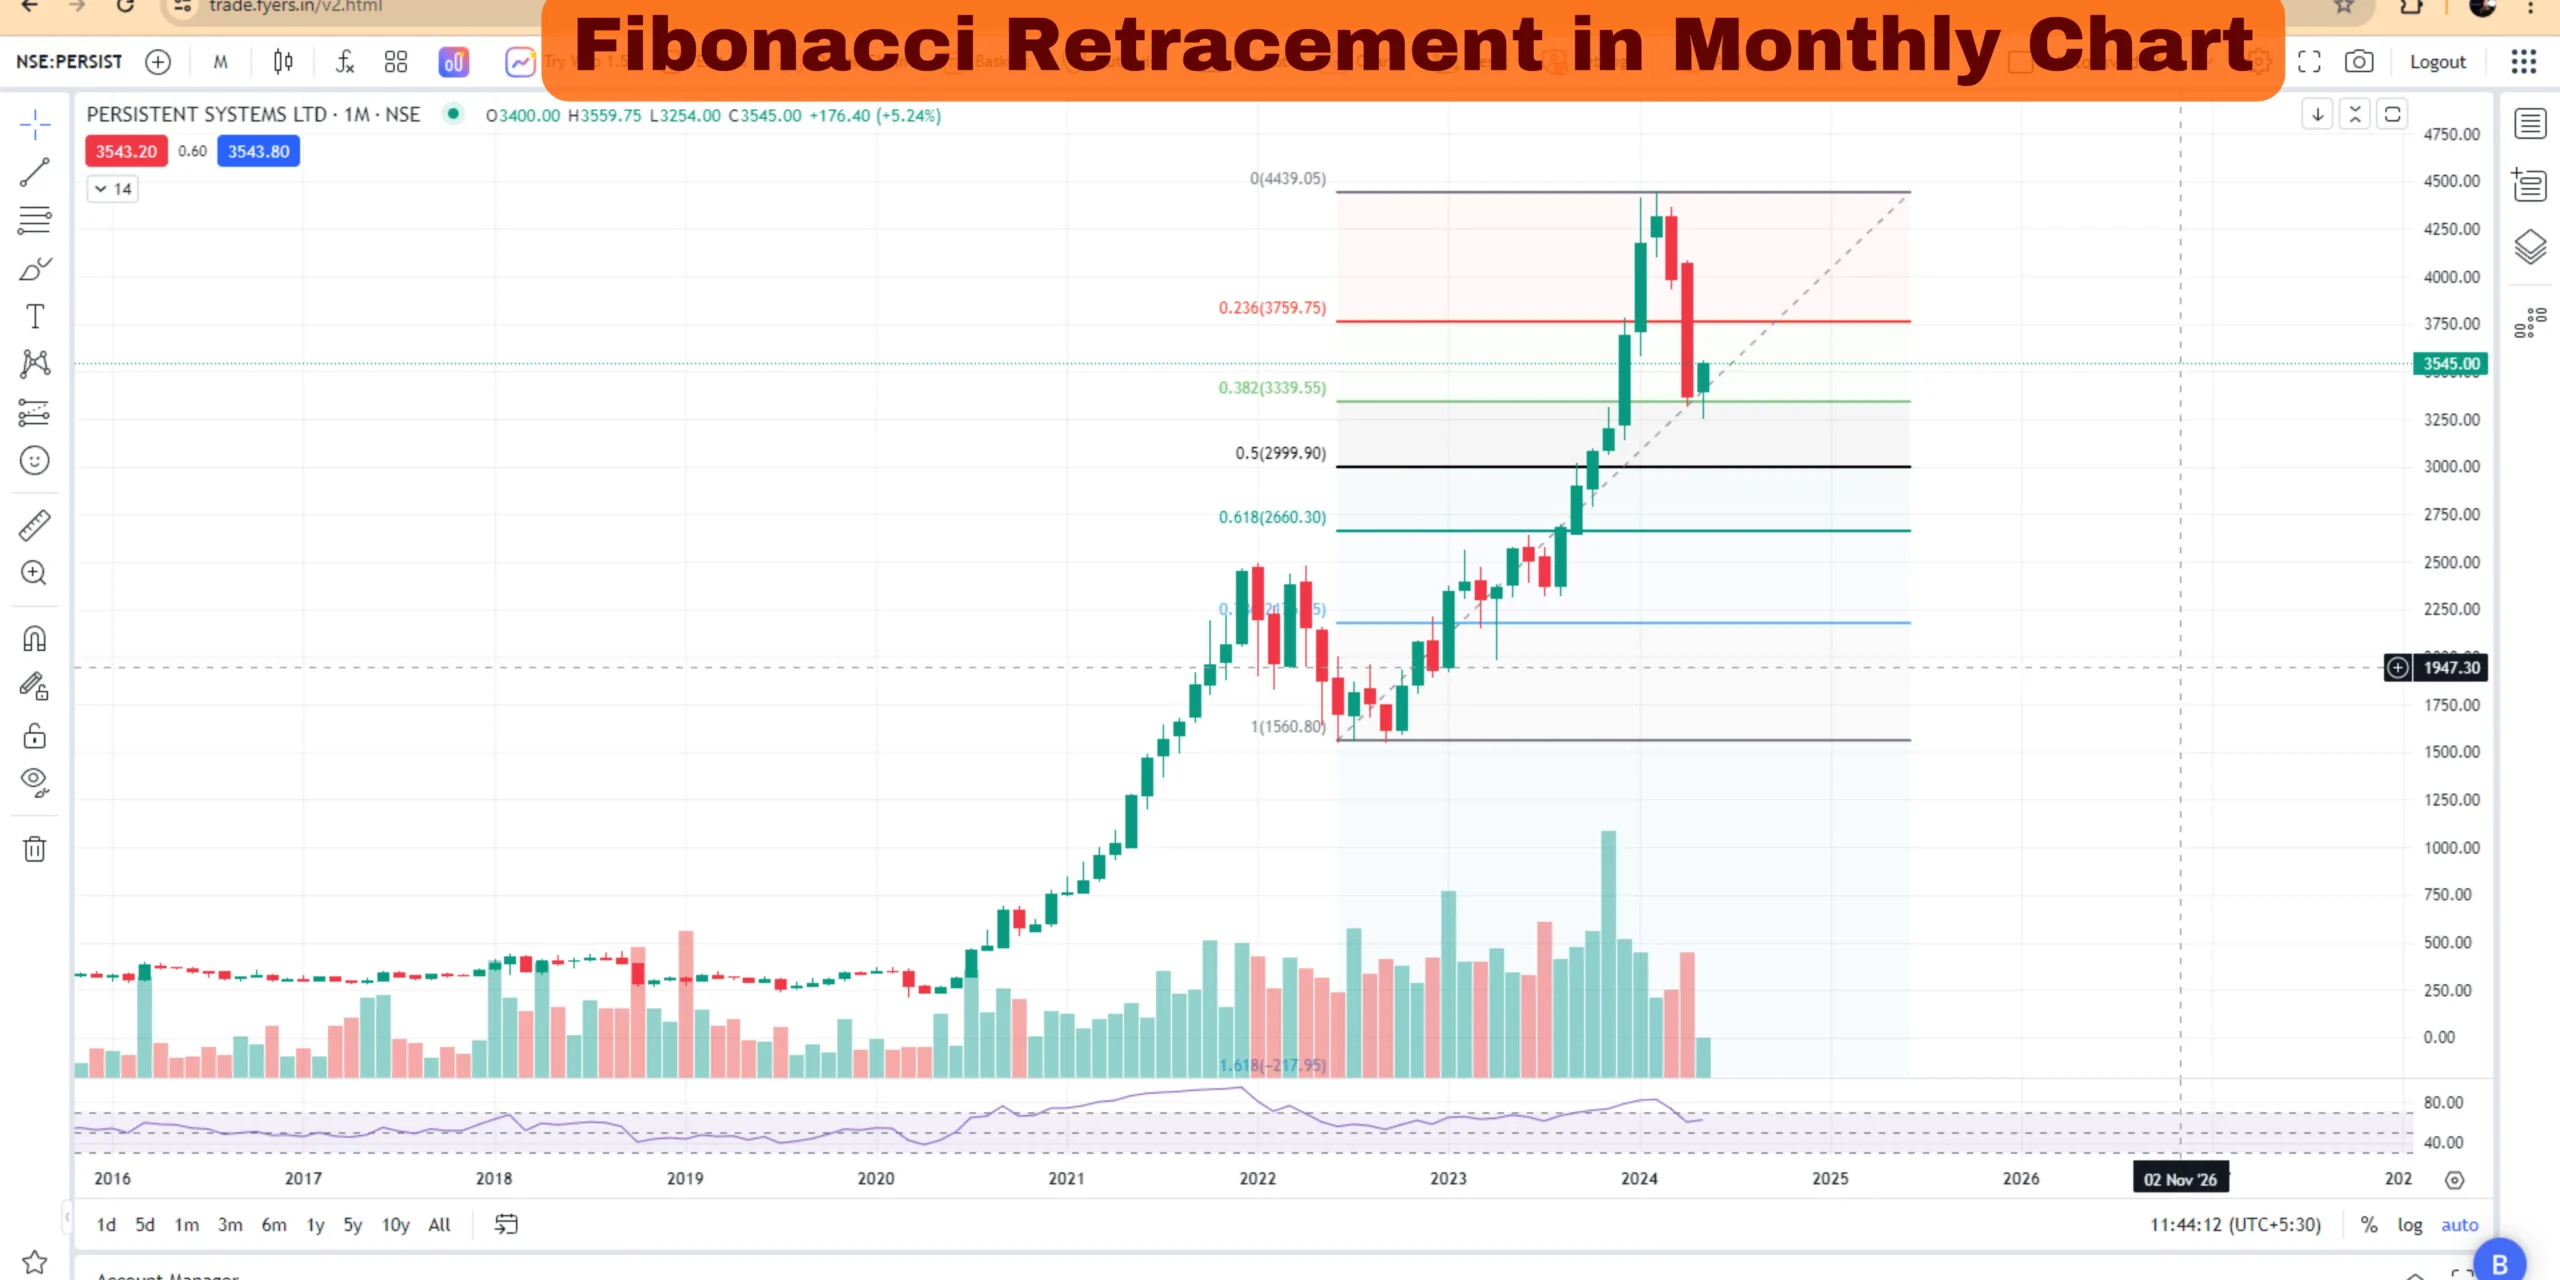
On the monthly chart, an inside bar candlestick pattern is forming. This pattern suggests a period of consolidation, with the current month’s price action contained within the range of the previous month. According to Fibonacci retracement, the share price currently sits at the 0.382 level, indicating a favourable point for a potential reversal. This suggests a high likelihood of upward movement in the Persistent Systems Share Price.
Chart Pattern:
Monthly price action suggests a retracement from previous highs, indicating a temporary pause in the upward trajectory. However, the consolidation phase may serve as a precursor to the next leg up for the Persistent Systems Share Price.
Price Support Level:
The monthly support range spans from 3150 to 3250, offering a broad support zone for the share price. This range ensures stability even in adverse market conditions, providing a solid foundation for the stock.
Comprehensive Interpretation
Overall, the Persistent Systems Share Price demonstrates strong bullish signals across multiple timeframes. The daily and weekly charts depict robust candlestick and chart patterns, suggesting sustained upward momentum. Additionally, solid support levels provide a safety net for investors, reinforcing the bullish sentiment surrounding the stock.
The monthly timeframe signals a temporary consolidation phase, with potential for a reversal from the current Fibonacci retracement level. The broad support range ensures stability, underscoring the resilience of the Persistent Systems Share Price.
In conclusion, the Persistent Systems Share Price analysis indicates a positive outlook, supported by bullish price action and solid support levels. With strong momentum across various timeframes, the stock presents promising opportunities for investors. Monitoring key resistance levels will be crucial for confirming the continuation of the upward trend in the Persistent Systems Share Price.
Indicators Use for Technical Analysis
Bolinger Band (BB):
Bolinger Band Price level in Persistent Systems Share Price (As of 15th May 2024) | |||
| Upper Band | Median | Lower Band |
Bolinger Band | 3815.36 | 3480.42 | 3145 |
Examining the Persistent Systems Share Price through Bollinger Bands offers insights into potential price levels and trends. As of May 15, 2024, the upper band stands at 3815.36, indicating a resistance level. The median, at 3480.42, serves as a strong daily support, while the lower band, at 3145, provides medium- and long-term support.
These bands help investors gauge the stock’s volatility and potential price movements. The upper band signals potential overvaluation, prompting caution for traders. Conversely, the lower band suggests opportunities for accumulation, indicating potential undervaluation. The median acts as a reference point for equilibrium, where buying and selling pressures are balanced.
Understanding these Bollinger Band levels empowers investors to make informed decisions, enabling them to capitalize on potential price fluctuations in the Persistent Systems Share Price.
Moving Average (MA):
Moving Average price level in daily candlestick of Persistent Systems Share Price (As of 15th May 2024) | ||
Moving Average | 100 Day | 200 Day |
Simple Moving Average (SMA) | 3923.26 | 3406.91 |
Exponential Moving Average (EMA) | 3720.06 | 3445.27 |
Analysing the Persistent Systems Share Price through moving averages provides valuable insights into potential support and resistance levels. As of May 15, 2024, both simple moving averages (SMA) and exponential moving averages (EMA) offer crucial reference points for traders and investors.
Simple Moving Average (SMA)
The 100-day SMA, standing at 3923.26, indicates a significant support level in the short term for the Persistent Systems Share Price. This moving average suggests an average price over the past 100 days, serving as a reference point for assessing the stock’s current price in relation to its recent performance. Traders often look to the 100-day SMA to gauge short-term trends and potential support levels.
Similarly, the 200-day SMA, at 3406.91, provides strong support in the short term for the Persistent Systems Share Price. This longer-term moving average reflects the average price over the past 200 days, offering insights into broader price trends and potential areas of price stability. Investors often use the 200-day SMA to assess long-term trends and identify potential buying opportunities.
Exponential Moving Average (EMA)
The 100-day EMA, positioned at 3720.06, also indicates strong support in the short term for the Persistent Systems Share Price. Unlike the SMA, the EMA places greater emphasis on recent price data, making it more responsive to recent price changes. This moving average provides a dynamic view of price trends and is often favoured by traders seeking to capitalize on short-term movements.
Similarly, the 200-day EMA, at 3445.27, represents strong support in the short term for the Persistent Systems Share Price. Like the 100-day EMA, this moving average offers insights into short-term price trends while incorporating a longer time frame to smooth out fluctuations. Traders and investors use the 200-day EMA to identify potential entry or exit points based on short-term price movements.
Relative Strength Index (RSI):
Relative Strength Index (RSI) of Persistent Systems Share Price (As of 15th May 2024) | |||
| Daily | Weekly | Monthly |
Relative Strength Index (RSI) | 41.52 | 44.1 | 61.2 |
As of May 15, 2024, the Relative Strength Index (RSI) for the Persistent Systems Share Price stands at 41.52 on the daily timeframe, indicating a neutral position. In the weekly timeframe, the RSI is slightly higher at 44.1, suggesting a slightly stronger bullish momentum. On the monthly timeframe, the RSI is 61.2, indicating a bullish sentiment with potential upward momentum. The RSI provides valuable insights into the stock’s strength and momentum, aiding investors in making informed decisions regarding the Persistent Systems Share Price.
Conclusion
In conclusion, based on our comprehensive analysis, we recommend considering an investment in Persistent Systems Ltd. The company demonstrates strengths in operational efficiency, revenue growth, and earnings per share (EPS) growth. Despite some concerns regarding declining profitability ratios and interest coverage, Persistent Systems Ltd. maintains a stable financial position with low debt levels and improving return on equity (ROE).
Additionally, the technical analysis of Persistent Systems Share Price suggests a bullish outlook across multiple timeframes. Candlestick patterns, chart formations, and support and resistance levels indicate potential for upward movement. Bollinger Bands, moving averages, and the Relative Strength Index (RSI) provide further confirmation of positive price momentum.
Considering these factors alongside market conditions and industry trends, investors may find Persistent Systems Ltd. to be a promising investment opportunity. However, it’s essential to conduct thorough due diligence and consult with a financial advisor before making any investment decisions. With its strategic acquisitions, innovative services, and steady growth trajectory, Persistent Systems Ltd. is positioned for continued success in the technology services sector.
FAQs
- What is Persistent Systems Ltd.?
Persistent Systems Ltd. is a multinational technology services company based in Pune, India. It specializes in cloud computing, Internet of Things (IoT), endpoint security, big data analytics, and software product engineering.
- When was Persistent Systems Ltd. founded?
Persistent Systems Ltd. was founded in 1990 by Anand Deshpande, a former employee of Hewlett-Packard.
- Where is Persistent Systems Ltd. listed?
Persistent Systems Ltd. is listed on both the National Stock Exchange of India (NSE) and the Bombay Stock Exchange (BSE). It went public in March 2010.
- What are the main services offered by Persistent Systems Ltd.?
Persistent Systems Ltd. offers services in cloud computing, IoT, endpoint security, big data analytics, and software product engineering.
- What is the current share price of Persistent Systems Ltd.?
The current share price of Persistent Systems Ltd. is subject to change and can be obtained from financial news websites, stock market apps, or by contacting your stockbroker.
- Does Persistent Systems Ltd. have any subsidiaries?
Yes, Persistent Systems Ltd. has subsidiaries registered in various countries, including the USA, Singapore, France, Malaysia, Germany, Ireland, the UK, Sri Lanka, Israel, and Mexico.
- What is the shareholding pattern of Persistent Systems Ltd.?
The shareholding pattern of Persistent Systems Ltd. includes Promoter Shareholding, FII (Foreign Institutional Investor) Shareholding, DII (Domestic Institutional Investor) Shareholding, MF (Mutual Fund) Shareholding, and Retail and Others.
- How has Persistent Systems Ltd. performed financially in recent years?
Persistent Systems Ltd.’s financial performance can be assessed through various fundamental analysis ratios such as profitability ratios, liquidity ratios, solvency ratios, efficiency ratios, valuation ratios, and growth ratios.
- What are some recent acquisitions made by Persistent Systems Ltd.?
Recent acquisitions made by Persistent Systems Ltd. include cloud migration company Sure line Systems, Software Corporation International (SCI), New Jersey-based IT and cloud management company Shree Partners, American consulting firm Data Glove, and cloud computing services company Media Agility.
- Is Persistent Systems Ltd. a good investment opportunity?
Investing in Persistent Systems Ltd. requires careful consideration of its financial health, market conditions, and industry trends. While the company has shown strengths in various areas, investors should conduct thorough research and seek advice from financial experts before making investment decisions.

