Discover how Airbnb has revolutionized the travel industry, provided unique accommodations and supported local economies. Explore a comprehensive financial analysis of Airbnb, including key ratios and stock performance, and learn about the company’s growth prospects and sustainability initiatives. Whether you’re a traveller or a host, find out how Airbnb can meet your modern travel needs.

Airbnb has revolutionized the travel industry by providing a platform for individuals to rent out their properties to travellers. Founded in 2008, Airbnb offers a diverse range of accommodations, from budget-friendly rooms to luxurious villas and unique stays like treehouses and yurts. For travellers, it provides a more authentic and often more affordable alternative to traditional hotels, allowing them to experience local life in unique settings.
Hosts benefit from additional income and the opportunity to meet people from around the world. The process is straightforward: hosts create listings with detailed descriptions and photos, while guests can search and book properties based on their preferences. Safety is prioritized through verified identities and secure payment processes, with a robust review system ensuring transparency and trust.
Airbnb’s impact extends beyond just lodging; it supports local economies and promotes cultural exchange. As it continues to grow, Airbnb is expanding its offerings to include experiences and long-term stays, while also focusing on sustainability initiatives. Whether you’re a traveller looking for unique accommodations or a host seeking to maximize your property’s potential, Airbnb provides a comprehensive solution for modern travel needs.

Airbnb has evolved into a significant player in the hospitality and travel industry. To understand its financial health and performance, we delve into key financial ratios over the last five years, focusing on valuation, liquidity, solvency, profitability, and efficiency. This analysis provides a comprehensive view of Airbnb’s financial trajectory, helping investors and stakeholders make informed decisions.
Fundamental analysis of Airbnb | |||||
Ratio | LTM (Last Twelve Months) | September 2023 | September 2022 | September 2021 | September 2020 |
Valuation Ratio | |||||
Price to Earnings Ratio (PE) | 18.8 | 18.1 | 28.77 | -291.4 | -9.105 |
Price to Book Ratio | 11.76 | 10.62 | 9.796 | 21.47 | 14.39 |
Price Earnings to Growth Ratio | 0.71 | 0.118 | -0.046 | 3.02 | -0.008 |
EV to EBITDA | 38.49 | 35.3 | 21.61 | 248.5 | -8.896 |
Liquidity Ratio | |||||
Current Ratio | 1.442 | 1.659 | 1.863 | 1.948 | 1.735 |
Quick Ratio | 0.802 | 1.04 | 1.806 | 1.893 | 1.668 |
Solvency Ratio | |||||
Debt to Equity Ratio | 0.26 | 0.251 | 0.421 | 0.506 | 0.794 |
Interest Coverage Ratio | 20.56 | 18.29 | 75.08 | 0.979 | -20.91 |
Profitability Ratio | |||||
Gross Profit Margin | 80.08% | 82.83% | 82.15% | 80.71% | 74.07% |
Net Profit Margin | 48.23% | 48.32% | 22.54% | -5.87% | -135.71% |
Return on Equity (ROE) | 65.32% | 58.69% | 34.05% | -7.37% | -158% |
Return on Invested Capital | 139.75% | 90.24% | 251.47% | 39.27% | 2728.72% |
Efficient Ratio | |||||
Inventory Turnover Ratio | 0 | 0 | 0 | 78.3 | 25.88 |
Receivables Turnover Ratio | 48.31 | 39.83 | 1.756 | 1.613 | 1.549 |
Valuation Ratios
Price to Earnings Ratio (PE):
The PE ratio indicates how much investors are willing to pay for a dollar of earnings. Airbnb’s PE ratio has significantly improved from negative values in 2020 and 2021, reflecting losses during those years. By September 2022, the PE ratio was 28.77, indicating a high valuation despite lower earnings. The decrease to 18.1 in September 2023 and further to 18.8 LTM suggests a more reasonable valuation relative to earnings, likely due to improved profitability.
Price to Book Ratio:
The Price to Book ratio shows the market’s valuation relative to the company’s book value. The ratio peaked in September 2021 at 21.47, indicating a high market valuation relative to the company’s net assets. It has since decreased, showing a more balanced valuation, with a notable dip in 2023 to 10.62, and a slight increase to 11.76 LTM.
Price Earnings to Growth Ratio (PEG):
The PEG ratio adjusts the PE ratio for growth. A ratio below 1 typically indicates undervaluation. Airbnb’s PEG ratio has improved from negative values in 2020 and 2022, suggesting negative growth expectations during those periods. The drastic drop to 0.118 in September 2023 and 0.71 LTM highlights strong growth potential relative to its earnings, indicating undervaluation.
EV to EBITDA:
The EV to EBITDA ratio measures the value of the company relative to its earnings before interest, taxes, depreciation, and amortization. A high ratio in 2021 (248.5) indicates a high valuation despite low earnings. The negative value in 2020 reflects significant losses. The ratio’s decrease to 35.3 in 2023 and 38.49 LTM suggests a more stable and reasonable valuation in line with improved EBITDA.
Liquidity Ratios
Current Ratio:
The Current Ratio measures Airbnb’s ability to cover short-term liabilities with short-term assets. A ratio above 1 indicates sufficient liquidity. Airbnb’s current ratio has been consistently above 1, indicating good liquidity. However, the decreasing trend from 1.948 in 2021 to 1.442 LTM suggests a slight decline in liquidity.
Quick Ratio:
The Quick Ratio is a more stringent measure of liquidity, excluding inventory. Airbnb’s quick ratio has shown a notable decline from 1.893 in 2021 to 0.802 LTM, indicating a reduced ability to meet short-term obligations quickly.
Solvency Ratios
Debt to Equity Ratio:
The Debt to Equity Ratio shows the proportion of debt used to finance the company’s assets relative to equity. Airbnb’s ratio has steadily decreased from 0.794 in 2020 to 0.26 LTM, indicating a significant reduction in debt reliance, improving financial stability.
Interest Coverage Ratio:
The Interest Coverage Ratio measures the ability to cover interest expenses with operating income. Airbnb’s dramatic improvement from negative values in 2020 to 20.56 LTM shows a robust ability to meet interest obligations, reflecting improved profitability and financial health.
Profitability Ratios
Gross Profit Margin:
The Gross Profit Margin indicates the percentage of revenue remaining after the cost of goods sold. Airbnb’s margin has consistently been high, with a peak at 82.83% in 2023, demonstrating strong control over costs relative to revenue.
Net Profit Margin:
The Net Profit Margin reflects overall profitability. Airbnb’s net margin improved significantly from negative values in 2020 and 2021 to 48.23% LTM, highlighting substantial profit growth.
Return on Equity (ROE):
The ROE measures profitability relative to equity. Airbnb’s ROE has seen a remarkable turnaround from negative values in 2020 and 2021 to 65.32% LTM, indicating efficient use of equity to generate profits.
Return on Invested Capital (ROIC):
The ROIC assesses the return on all invested capital. The exceptionally high ROIC in 2020 (2728.72%) indicates an anomaly, likely due to a low base effect. The ratio’s fluctuation suggests variability in investment returns, but a solid performance of 139.75% LTM shows strong profitability.
Efficiency Ratios
Inventory Turnover Ratio:
The Inventory Turnover Ratio is less relevant for Airbnb, as it operates in the service industry without significant inventory.
Receivables Turnover Ratio:
The Receivables Turnover Ratio measures efficiency in collecting receivables. Airbnb’s ratio has dramatically improved from around 1.5 in 2020-2022 to 48.31 LTM, indicating much faster collection of receivables, enhancing cash flow.
Airbnb’s financial performance has shown significant improvement over the past five years. The company has transitioned from substantial losses and high debt to robust profitability and lower debt levels. Valuation metrics indicate a more reasonable market valuation, while liquidity ratios suggest sufficient but declining liquidity. Solvency ratios highlight reduced reliance on debt, and profitability ratios reflect strong profit growth and efficient use of capital. Efficiency ratios show improvements in receivables management. Overall, Airbnb appears to be in a strong financial position, with positive trends across most key metrics.
Technical Analysis of Airbnb
Technical analysis of Airbnb involves evaluating price movements and trading volumes to forecast future price movements. Technical analysis depends on charts and statistical indicators. analysts use various techniques, such as trend analysis, chart patterns, and technical indicators like moving averages or relative strength index (RSI), to identify potential buying or selling opportunities for Airbnb. The main goal of technical analysis of Airbnb share price is to predict future price movements based on historical data and market psychology, helping investors make informed decisions about when to enter or exit trades. So, bellow we are explaining Various techniques as of 31st May 2024 for technical analysis of Airbnb.
Price action
Price action and price level of Airbnb | |||
Price action | Daily Timeframe | Weekly Timeframe | Monthly Timeframe |
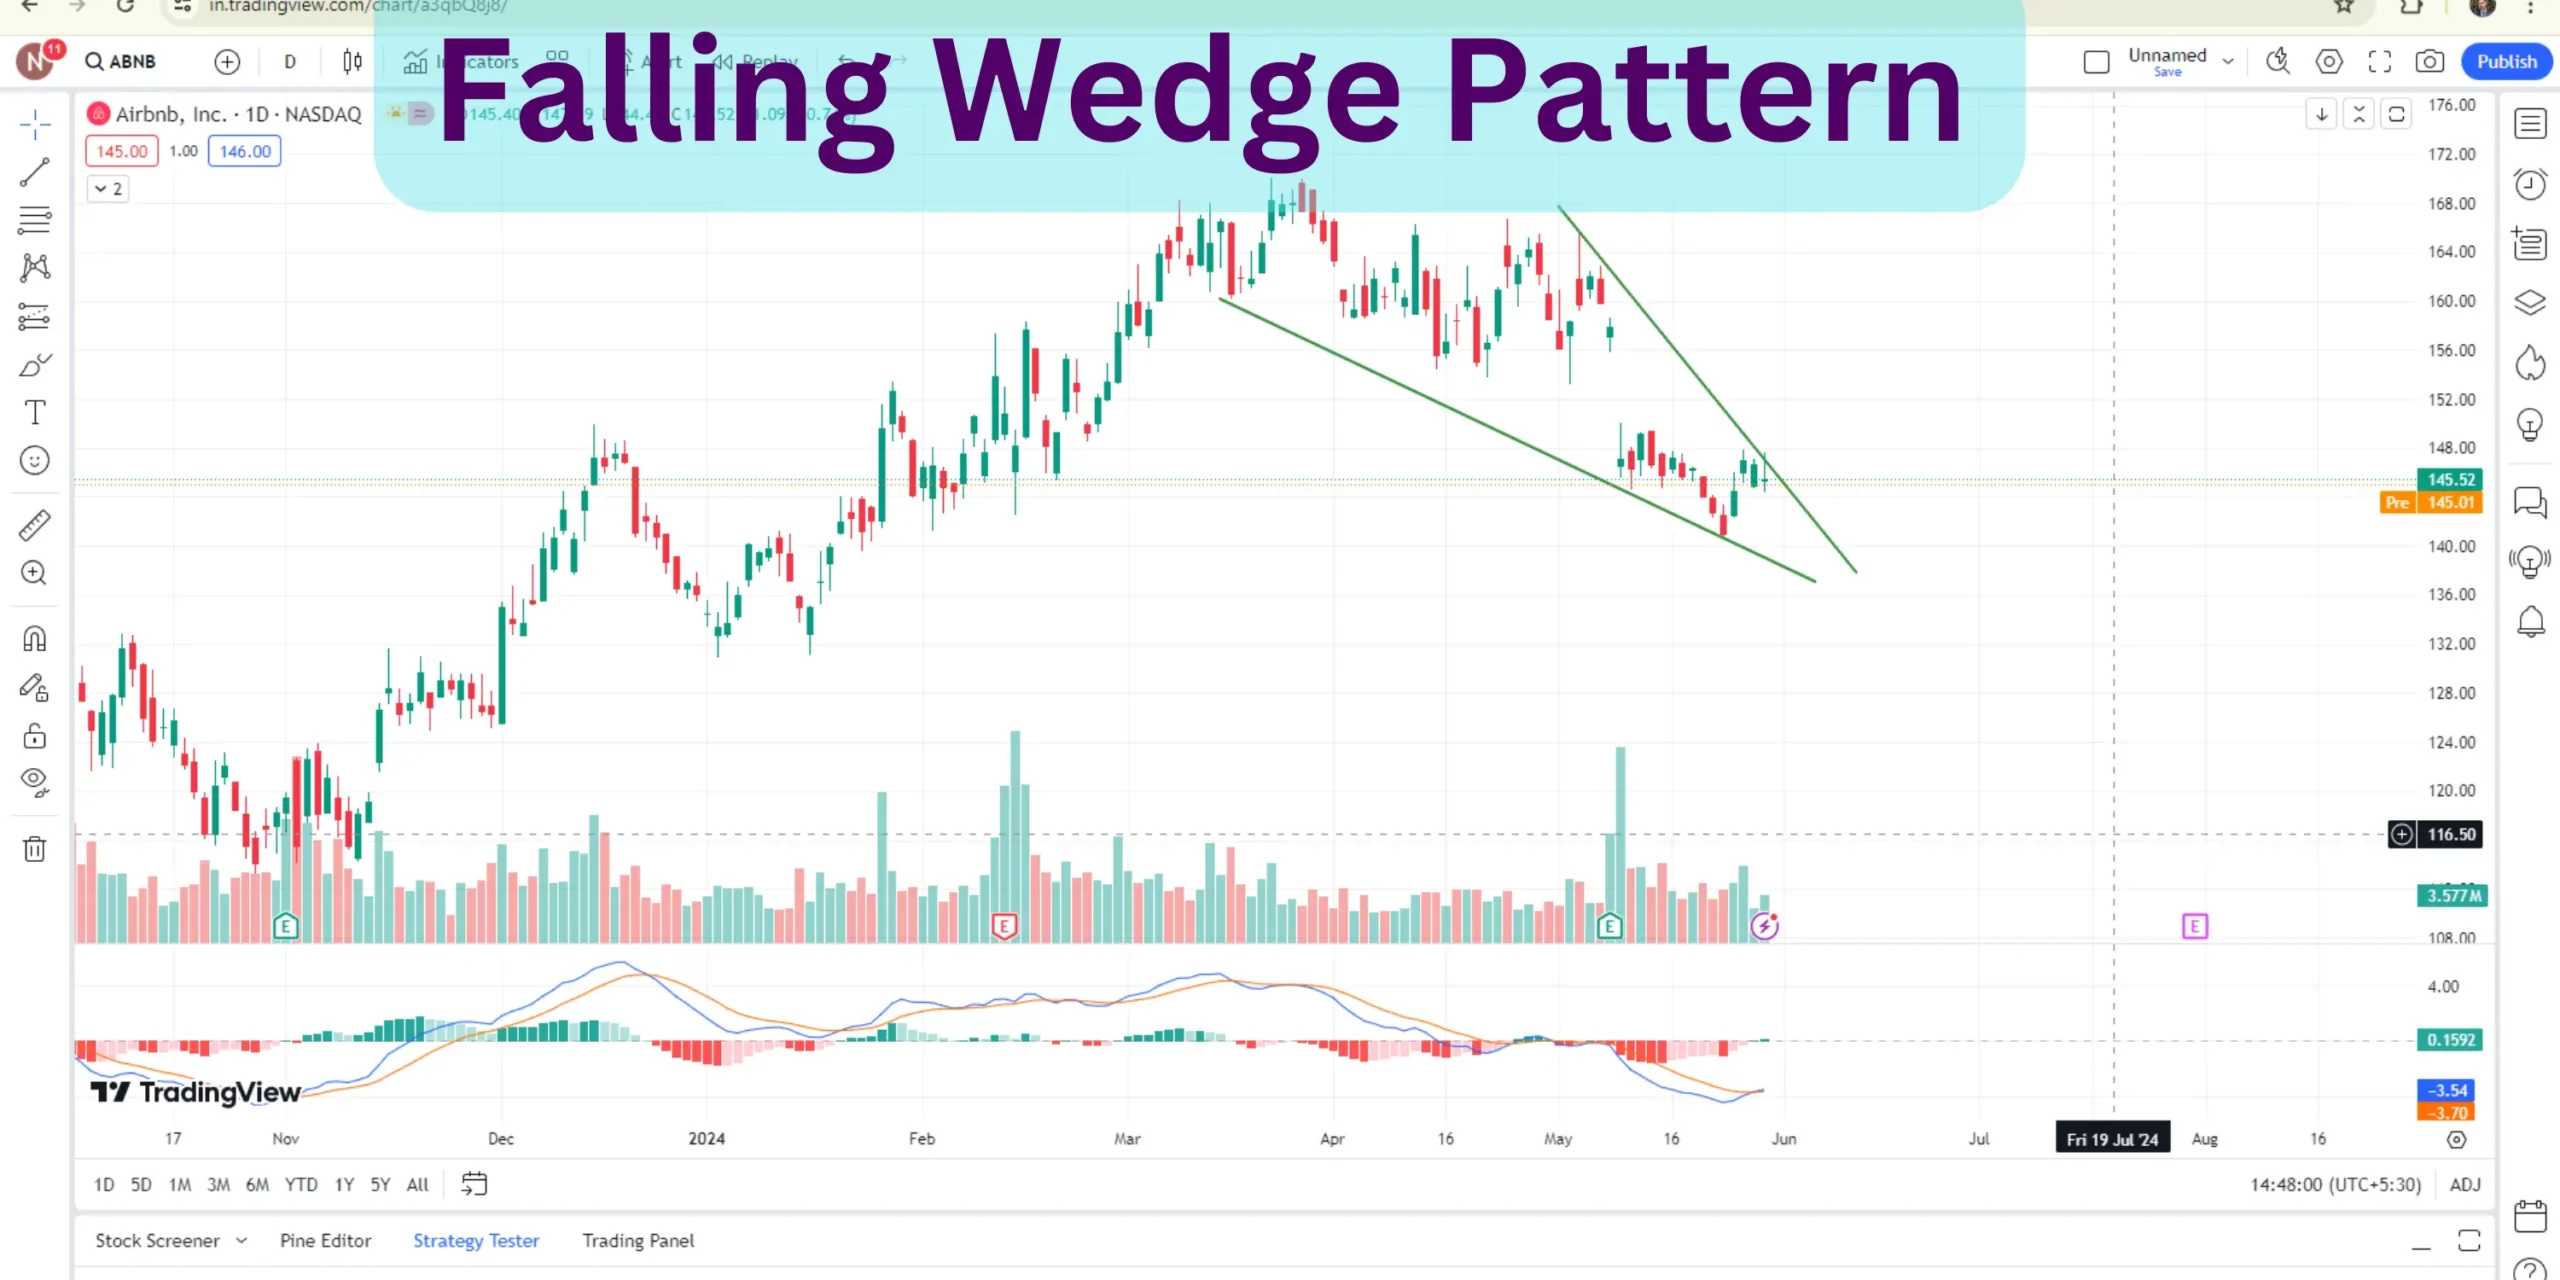
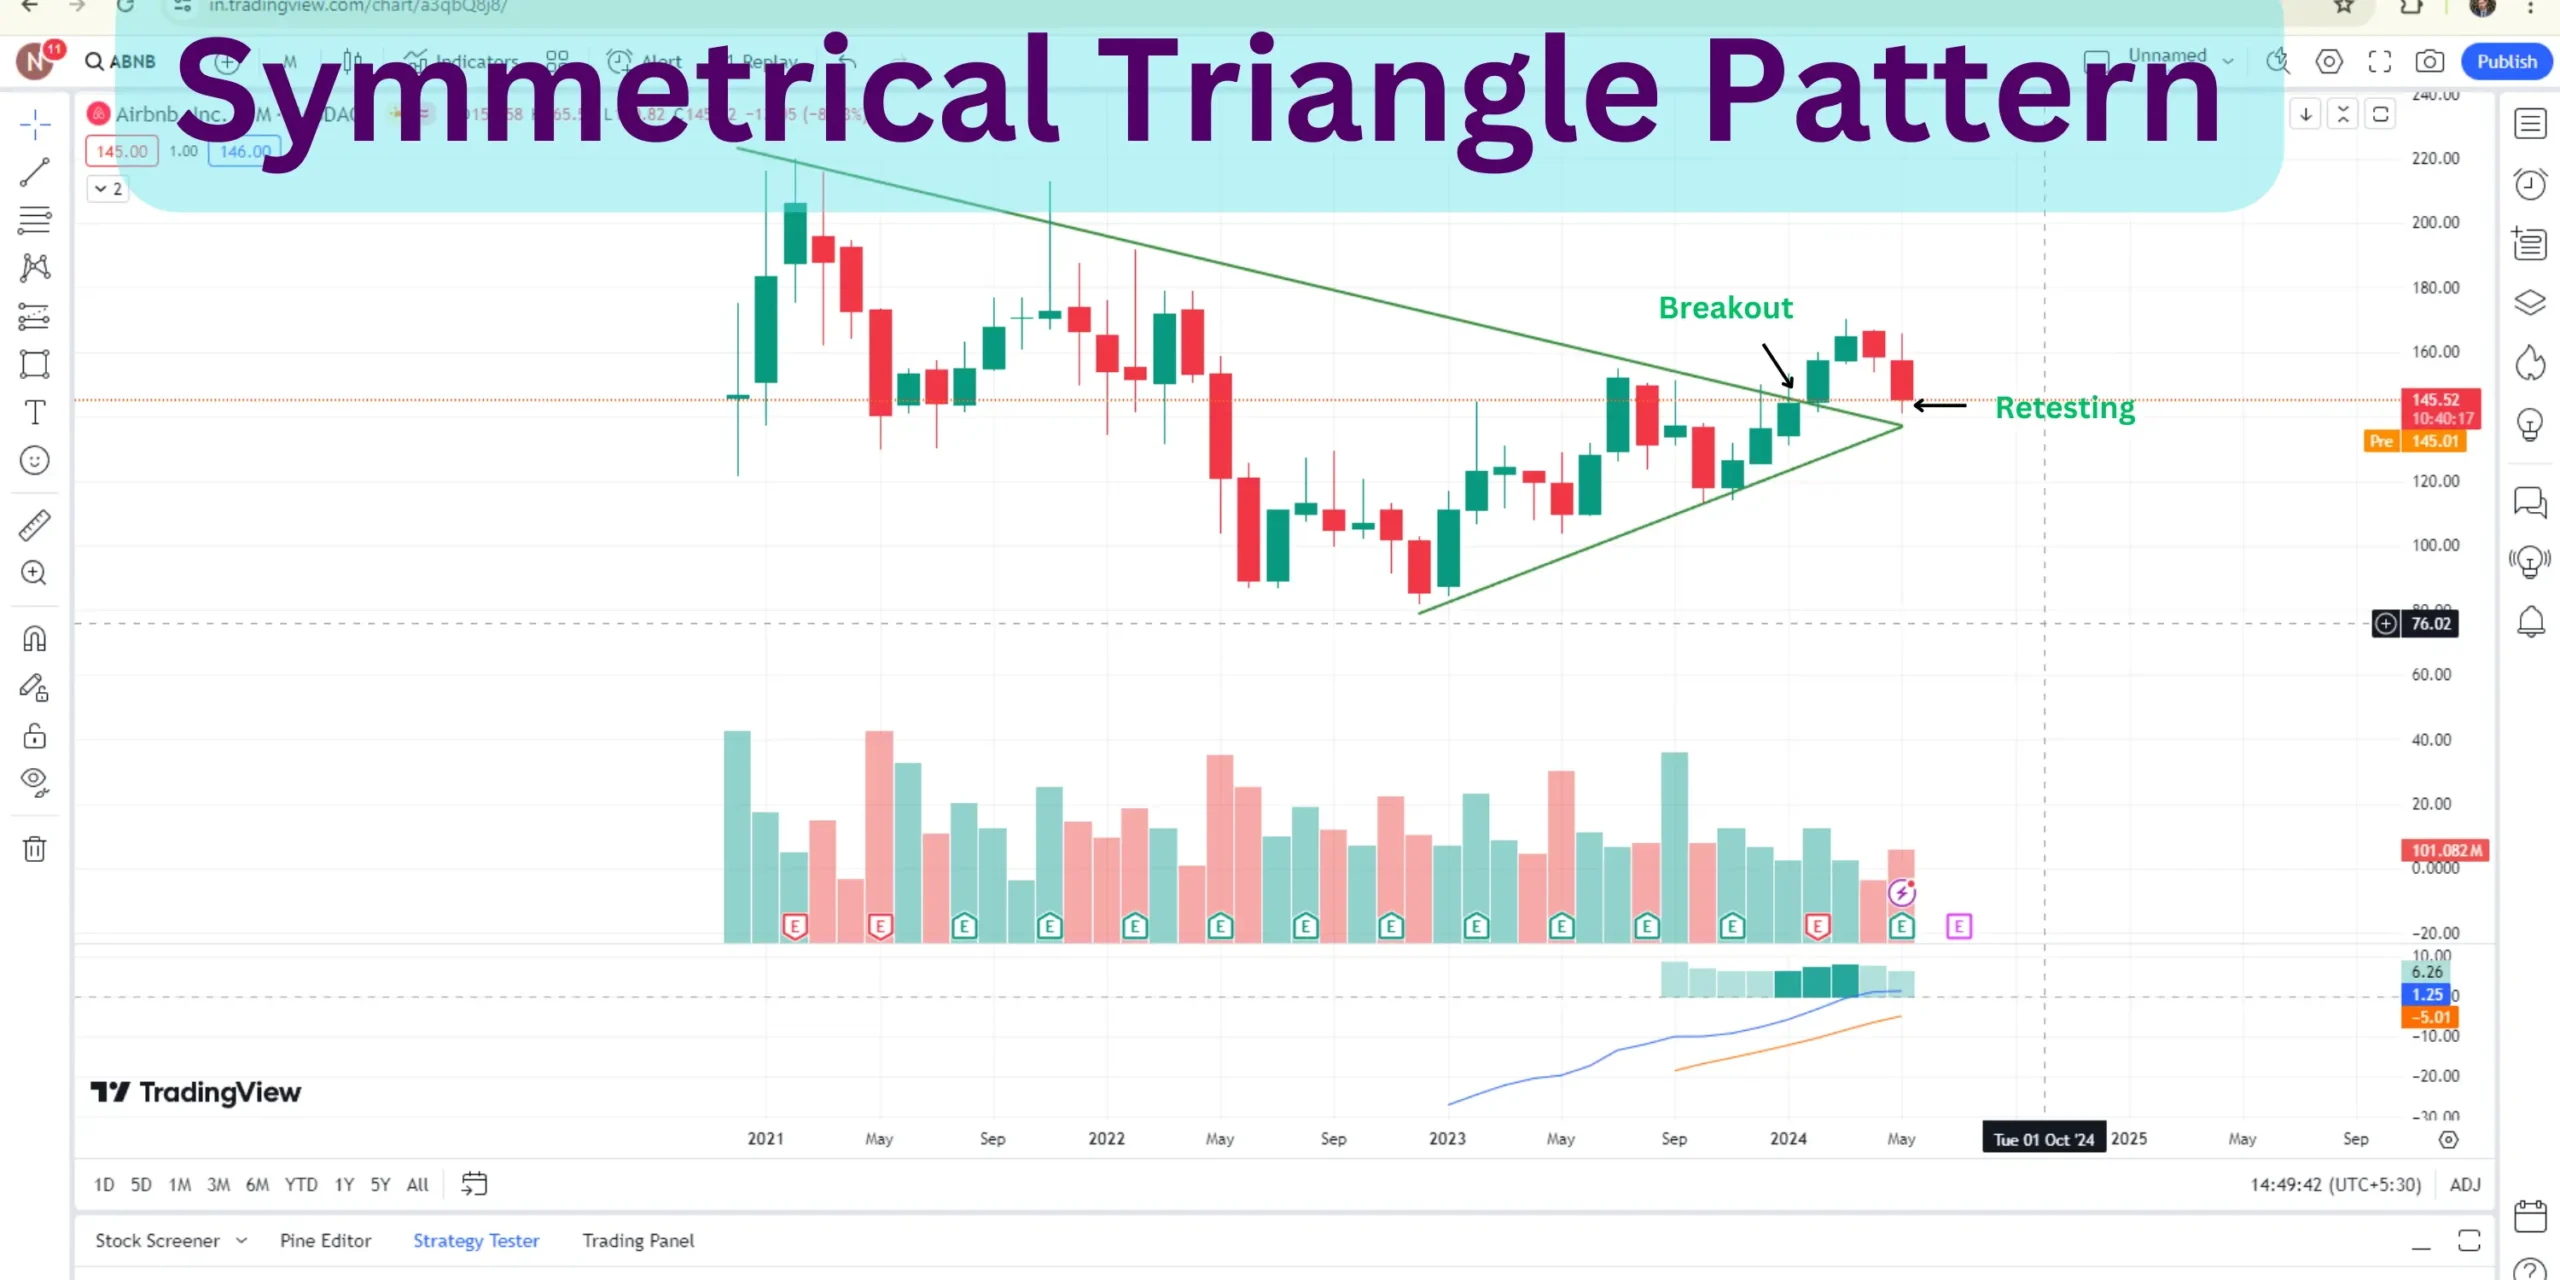
Candlestick | Doji Candlestick. | Doji Candlestick. | Red retesting Candlestick. |
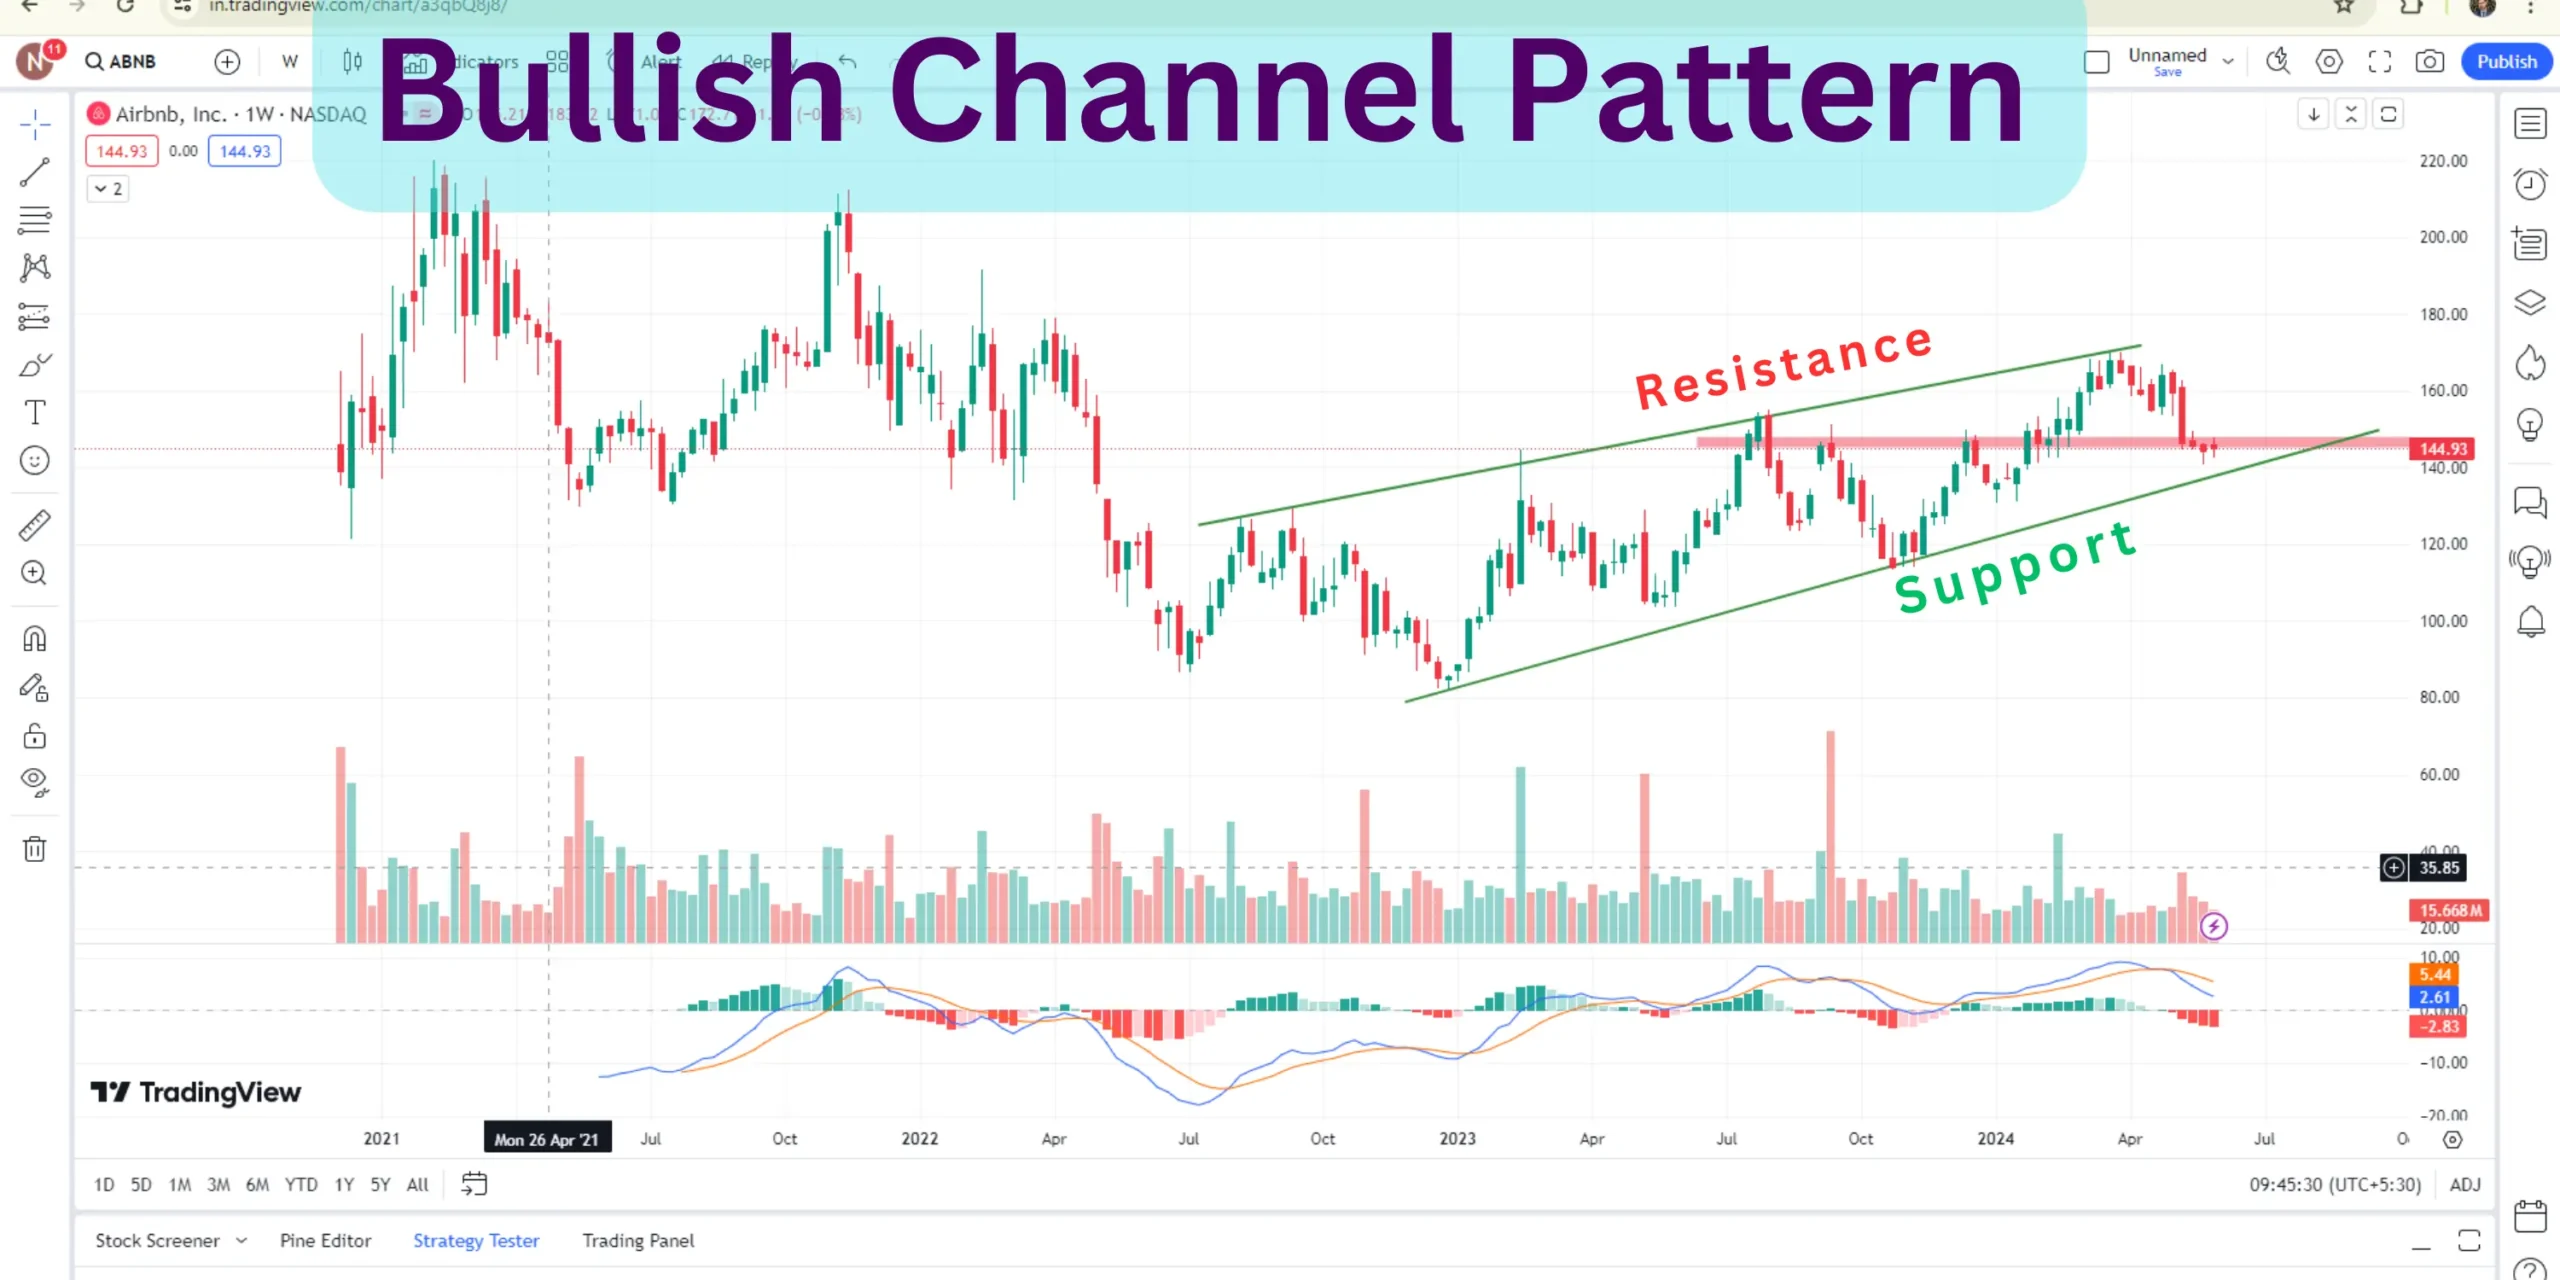
Chart Pattern | Falling Wedge pattern | Channel Pattern | Symmetrical triangle Pattern |
Price Support Level | 140-142 | 130-134, strong support zone for weekly candlestick | 113-120 |
Price Level | 145.52 is Current price of Airbnb Stock | 52 weeks High 170.10 | 52 weeks low 112.31 |
Analysing the price action and price levels of a stock provides crucial insights into its market performance. For investors and analysts monitoring Airbnb, understanding these dynamics is essential. This analysis delves into the daily, weekly, and monthly timeframes to provide a comprehensive view of Airbnb’s stock performance as of May 31, 2024.
Key Price Levels
Current Price: $145.52
52-Week High: $170.10
52-Week Low: $112.31
The current price of Airbnb stock is $145.52, indicating that it is trading above the critical support level of 140-142. This positioning is vital for short-term traders and investors, as maintaining above this support could pave the way for a bullish reversal.
Airbnb’s stock is trading closer to its 52-week high, showing that despite recent corrections, the stock has performed well over the past year.

Daily Timeframe Analysis
Candlestick Pattern: Doji Candlestick
On the daily timeframe, Airbnb’s stock displayed a Doji candlestick. A Doji candlestick signifies indecision in the market, where the opening and closing prices are nearly identical. This pattern suggests that neither buyers nor sellers dominated the market, leading to a stalemate.
Throughout the month, Airbnb’s stock experienced significant consolidation. Despite some fluctuations, the price corrected by nearly 17%. This considerable correction indicates a phase where the stock price was stabilizing after previous movements. Consolidation phases are often followed by significant price movements, as they represent periods where market participants accumulate positions before a breakout.
Chart Pattern: Falling Wedge
The Falling Wedge pattern observed on the daily chart indicates a bullish reversal pattern. The stock price has been falling from $170, narrowing as it descends. This pattern suggests that while the stock has been on a downward trend, the decreasing rate of decline hints at a potential reversal, signaling that a bullish breakout might be on the horizon.
Price Support Level:
The support level at 140-142 is crucial. Support levels are price points where a stock tends to find buying interest, preventing the price from falling further. The 140-142 support range suggests that buyers are likely to step in if the stock price dips to this level, providing a safety net against further declines.

Weekly Timeframe Analysis
Candlestick Pattern: Doji and Hammer Candlestick
On the weekly timeframe, the stock also shows a Doji candlestick, reinforcing the indecision observed in the daily analysis. Additionally, the formation of a hammer candlestick last week indicates a potential reversal from the downward trend. A hammer candlestick typically suggests that the market is testing lower prices but finds significant buying interest, pushing the price back up.
Chart Pattern: Channel Pattern
A Channel Pattern has formed on the weekly chart, with Airbnb’s stock price making higher lows, suggesting a gradual upward trend within a defined range. The stock is currently taking support at the lower trend line of this channel, indicating strong buying interest at this level.
Price Support Level:
The weekly support zone at 130-134 is a strong support level for Airbnb stock. This range is crucial as it has historically seen significant buying interest, preventing the stock price from falling further.

Monthly Timeframe Analysis
Candlestick Pattern: Red Retesting Candlestick
On the monthly timeframe, Airbnb’s stock shows a red retesting candlestick. This pattern suggests that the stock price is retesting previous levels after a breakout, typically seen when the market is assessing the sustainability of prior gains.
Chart Pattern: Symmetrical Triangle
A Symmetrical Triangle pattern is observed on the monthly chart. This pattern indicates that the stock is making higher lows and lower highs, converging towards a point. Symmetrical triangles often signal a period of consolidation before a breakout in either direction. Given the higher lows, there is a bullish bias to this pattern, indicating a potential upward breakout.
Price Support Level:
The monthly support level lies in the range of 113-120. This broader support zone provides a long-term safety net for the stock price, indicating areas where buyers are likely to enter the market if the stock experiences significant declines.
Conclusion
Airbnb’s stock analysis across daily, weekly, and monthly timeframes presents a detailed picture of its current market performance and potential future movements. The Doji candlesticks in both daily and weekly charts suggest market indecision, but the presence of a hammer candlestick on the weekly chart indicates potential bullish reversal. The Falling Wedge pattern on the daily chart and the Channel Pattern on the weekly chart further support this bullish outlook, with significant support levels at 140-142 and 130-134, respectively.
On the monthly timeframe, the red retesting candlestick and the Symmetrical Triangle pattern highlight a consolidation phase, suggesting that the stock is gearing up for a significant move. The strong support levels across all timeframes provide a safety net for the stock, while the current price of $145.52 positions Airbnb well above these crucial support zones.
Overall, while there is some market indecision and recent price corrections, the technical patterns and support levels indicate a potential bullish outlook for Airbnb in the near future. Investors should closely monitor these key levels and patterns to make informed decisions about their positions in Airbnb stock.
FAQs
- What is Airbnb?
Airbnb is an online marketplace that connects people looking to rent out their homes with those seeking accommodations. It offers a wide range of properties including apartments, houses, and unique stays like treehouses and yurts.
- How does Airbnb work?
Airbnb allows hosts to list their properties with detailed descriptions and photos. Guests can search for accommodations based on their preferences and book directly through the platform. The process includes secure payment methods and a review system to ensure transparency and trust.
- What are the benefits of using Airbnb?
For travellers, Airbnb provides more authentic and often more affordable accommodations compared to traditional hotels. For hosts, it offers an opportunity to earn extra income and meet people from around the world. The platform also supports local economies by promoting tourism and cultural exchange.
- How do I book a stay on Airbnb?
To book a stay, search for your desired location on Airbnb, browse the listings, and select one that fits your needs. You can filter results by price, type of accommodation, amenities, and more. Once you find a suitable property, you can book it directly through the platform.
- Is Airbnb safe to use?
Airbnb prioritizes safety with verified identities and secure payment processes. Additionally, the review system allows guests and hosts to leave feedback about their experiences, promoting transparency and accountability.
- What is the Price to Earnings (PE) Ratio for Airbnb?
As of the last twelve months, the Price to Earnings Ratio (PE) for Airbnb is 18.8. This ratio helps investors understand how much they are paying for a dollar of Airbnb’s earnings. It has improved significantly from previous years, reflecting the company’s growing profitability.
- What does the Price to Book Ratio indicate for Airbnb?
The Price to Book Ratio for Airbnb is currently 11.76. This ratio compares the market value of the company to its book value, providing insight into how much investors are paying for the company’s net assets. A higher ratio indicates a premium valuation, reflecting investor confidence.
- What is the significance of Airbnb’s Gross Profit Margin?
Airbnb’s Gross Profit Margin stands at 80.08%. This high margin indicates the company’s strong control over its costs relative to its revenue, showcasing its efficiency in generating profit from its core operations.
- How has Airbnb’s Net Profit Margin changed over the years?
Airbnb’s Net Profit Margin has improved significantly, reaching 48.23% in the last twelve months. This marks a substantial increase from previous years, highlighting the company’s growing profitability and operational efficiency.
- What are the key support levels for Airbnb’s stock?
For Airbnb’s stock, key support levels include:
Daily Timeframe: 140-142 USD
Weekly Timeframe: 130-134 USD
Monthly Timeframe: 113-120 USD
These levels are crucial as they indicate points where the stock is likely to find buying interest, preventing further declines.
- What are the recent candlestick patterns observed for Airbnb?
Recent candlestick patterns for Airbnb include:
Daily Timeframe: Doji Candlestick, indicating market indecision.
Weekly Timeframe: Doji Candlestick with a Hammer Candlestick, suggesting a potential bullish reversal.
Monthly Timeframe: Red Retesting Candlestick, indicating consolidation and a potential retest of previous highs.
- What is the current price of Airbnb stock?
As of May 31, 2024, the current price of Airbnb stock is $145.52. This price is above key support levels, indicating relative strength and potential for further gains.
- How does Airbnb’s Quick Ratio reflect its liquidity?
Airbnb’s Quick Ratio is 0.802, indicating its ability to cover short-term liabilities with its most liquid assets. While slightly lower than ideal, it still shows that Airbnb can meet its immediate financial obligations.
- What are the future growth prospects for Airbnb?
Airbnb has shown strong growth prospects with improving profitability ratios and stable support levels. The company’s expansion into new markets, focus on unique experiences, and sustainability initiatives further bolster its potential for future growth.
- Can I invest in Airbnb stock?
Yes, you can invest in Airbnb stock, which is publicly traded under the ticker symbol ABNB. Before investing, it’s essential to conduct thorough research and consider the stock’s financial performance, market conditions, and personal investment goals.


1 thought on “Airbnb Stock is Now Ready to Fly”
Quality articles is the crucial to invite the visitors to go to
see the web page, that’s what this web site is providing.