Discover the latest trends and analysis of Astral share price. Learn how Astral Limited is charting its course for success in the market, backed by insightful data and expert analysis.

Experience Astral Limited’s pioneering journey in India’s building materials sector. Founded in 1996 as Astral Poly Technik Limited by Sandeep Engineer, the company swiftly became a leader in CPVC and PVC pipes. Evolving from its Ahmedabad roots, Astral Limited redefined industry norms, diversifying its offerings and embracing innovation. Milestones like its 2007 public listing and the introduction of PVC pipes in 2013 highlight its industry dominance. Notable advocacy, such as the 2017 Swachh Bharat Mission campaign, showcases Astral’s commitment to societal impact. Join us as we uncover Astral Limited’s transformative narrative, where innovation and integrity converge for a brighter future.

Astral Limited, formerly known as Astral Poly Technik Limited, is a renowned Indian company specializing in building materials and equipment. Headquartered in Ahmedabad, the company is primarily engaged in the production of chlorinated polyvinyl chloride (CPVC) and polyvinyl chloride (PVC) pipes. Founded in 1996 by Sandeep Engineer, Astral Poly Technik Limited initially focused on industrial CPVC pipes, leveraging technology licensed from Lubrizol. However, recognizing the growing demand in the plumbing sector, the company transitioned its focus within three years. By 2004, Astral began offering lead-free PVC pressure pipes, expanding its product range to include fire sprinkler systems, Soil, Waste and Rainwater (SWR) pipes, underground pipes, and other related sectors.
In 2007, Astral Limited went public, listing its shares on the National Stock Exchange of India and the Bombay Stock Exchange, marking a significant milestone in its journey. The year 2013 witnessed another pivotal moment with the introduction of PVC pipes, signaling the company’s entry into the agricultural market. In 2016, Astral terminated its partnership with Lubrizol, initiating operations at its own CPVC compounding facility in Santej, Gujarat, in collaboration with Sekisui Chemical.
One of Astral Limited’s most notable initiatives occurred in 2017, aligning with the Swachh Bharat Mission. The company released a direct-to-digital advertisement addressing issues of open defecation, women’s safety, and gender-based violence in India, garnering global attention for its impactful advocacy efforts.
Subsidiaries of Astral Limited
Astral Adhesives: Renowned as one of India’s premier manufacturers, Astral Adhesives provides a wide array of products including adhesives, sealants, putties, self-adhesives, tapes, solvent cement, and construction chemicals.
Seal It Services Limited: Established in 2002, Seal It Services Ltd specializes in the manufacturing of adhesives and sealants.
Rex Poly Extrusion Pvt Ltd: Founded in 2006, Rex Poly Extrusion Private Limited focuses on manufacturing plastic products, catering to various sectors.
Astral Pipes: Astral Pipes is a leader in producing top-quality plumbing and drainage systems for residential and commercial use. They also manufacture CPVC piping systems for industrial applications, as well as column and pressure piping systems for agriculture. With a commitment to embracing cutting-edge international technology, Astral Pipes offers tailored solutions for the Indian market.
Astral Biochem Private Limited: Established in 2008, Astral Biochem Private Limited engages in agricultural and animal husbandry service activities, excluding veterinary services.
Share Holding Pattern of Astral Limited
These figures represent significant actions taken by a company that directly influence shareholder value. They signify material changes within the company and have an impact on its stakeholders:
- Promoter Shareholding: 54.10%
- FII (Foreign Institutional Investor) Shareholding: 21.22%
- DII (Domestic Institutional Investor) Shareholding: 4.92%
- MF (Mutual Fund) Shareholding: 7.93%
- Retail and Others: 11.82%
A fundamental analysis of Astral share price we need a comprehensive examination of various financial ratios spanning profitability, liquidity, solvency, efficiency, valuation, and growth. These ratios provide insights into the company’s financial health, operational efficiency, and growth prospects over the years. Let’s delve into each ratio for March 2020, 2021, 2022, and 2023 to understand Astral Limited’s performance.
Fundamental Analysis of Astral share price | ||||
Ratio | March 2023 | March 2022 | March 2021 | March 2020 |
Profitability Ratio | ||||
Gross Profit Margin | 33.42% | 33.36% | 36.34% | 36.03% |
Net Profit Margin | 9.19% | 11.01% | 12.76% | 9.62% |
Return on Equity (ROE) | 17.48% | 20.71% | 21.33% | 16.49% |
Liquidity Ratio | ||||
Current Ratio | 1.69 | 1.85 | 1.84 | 1.57 |
Quick Ratio (Acid-Test Ratio) | 1.03 | 1.08 | 1.16 | 0.687 |
Solvency Ratio | ||||
Debt to Equity Ratio | 0.0303 | 0.0140 | 0.0381 | 0.083 |
Interest Coverage Ratio | 16.74 | 50.74 | 41.15 | 8.27 |
Efficient Ratio | ||||
Inventory Turnover Ratio | 4.27 | 4.86 | 3.99 | 3.52 |
Account Receivable Turnover Ratio | 15.83 | 14.79 | 10.73 | 9.48 |
Valuation Ratio | ||||
Price to earning Ratio (P/E) | 78.65 | 84.01 | 80.32 | 56.94 |
Price to Book Ratio (P/B) | 13.75 | 17.19 | 16.94 | 9.39 |
Growth Ratio | ||||
Earning per Share (EPS) Growth | 17.00 | 18.06 | 15.10 | 9.26 |
Revenue Growth (in Rs. Cr.) | 4,635.50 | 3,470.70 | 2,507.00 | 2,053.70 |
Profitability Ratio
Gross Profit Margin:
The gross profit margin measures the percentage of revenue retained after deducting the cost of goods sold. Astral Limited’s gross profit margin remained relatively stable, ranging from 33.36% to 36.34% between March 2020 and March 2023.
Net Profit Margin:
The net profit margin indicates the portion of revenue retained as net income after deducting all expenses. Astral Limited witnessed fluctuations in net profit margin, with a decrease from 12.76% in March 2021 to 9.19% in March 2023.
Return on Equity (ROE):
ROE reflects the company’s efficiency in generating profits from shareholders’ equity. Astral Limited’s ROE fluctuated, reaching its peak at 21.33% in March 2021 and declining to 17.48% in March 2023.
Liquidity Ratio
Current Ratio:
The current ratio assesses the company’s ability to meet short-term obligations using its current assets. Astral Limited’s current ratio remained above 1, indicating a healthy liquidity position, although it experienced a slight decline from 1.85 in March 2022 to 1.69 in March 2023.
Quick Ratio (Acid-Test Ratio):
The quick ratio measures the company’s ability to pay off its current liabilities using its most liquid assets. Astral Limited’s quick ratio fluctuated but generally remained above 1, indicating sufficient liquidity to cover short-term obligations.
Solvency Ratio
Debt to Equity Ratio:
The debt to equity ratio evaluates the proportion of debt relative to shareholders’ equity. Astral Limited maintained a low debt to equity ratio, indicating a conservative capital structure and lower financial risk over the years.
Interest Coverage Ratio:
The interest coverage ratio assesses the company’s ability to cover interest expenses with its earnings before interest and taxes (EBIT). Astral Limited demonstrated strong interest coverage ratios, indicating its capacity to service its debt obligations comfortably.
Efficiency Ratio
Inventory Turnover Ratio:
The inventory turnover ratio measures how efficiently Astral Limited manages its inventory. The company witnessed fluctuations in inventory turnover, reflecting changes in inventory management practices over the years.
Account Receivable Turnover Ratio:
The accounts receivable turnover ratio evaluates how efficiently Astral Limited collects payments from its customers. The increasing trend in this ratio suggests improvements in the company’s credit and collection policies.
Valuation Ratio
Price to Earnings Ratio (P/E):
The price to earnings ratio compares the company’s stock price to its earnings per share (EPS), indicating investors’ willingness to pay for each unit of earnings. Astral Limited’s P/E ratio exhibited fluctuations over the years, reflecting changes in market sentiment and earnings performance.
Price to Book Ratio (P/B):
The price to book ratio compares the company’s market value to its book value, providing insights into its valuation relative to its assets. Astral Limited’s P/B ratio fluctuated, reflecting changes in market perceptions of the company’s asset value.
Growth Ratio
Earnings per Share (EPS) Growth:
EPS growth measures the rate at which Astral Limited’s earnings per share have increased over time. The company demonstrated consistent EPS growth, indicating improving profitability and shareholder value.
Revenue Growth:
Revenue growth reflects Astral Limited’s ability to increase its top-line revenue over the years. The company experienced significant revenue growth, reflecting its expansion and market penetration efforts.
In conclusion, a fundamental analysis of Astral Limited’s financial ratios reveals a company with stable profitability, healthy liquidity and solvency, efficient operational management, attractive valuation metrics, and robust growth prospects. Investors should consider these factors alongside market dynamics and industry trends when making investment decisions.
Technical Analysis of Astral Limited
Technical analysis of Astral Limited involves evaluating price movements and trading volumes to forecast future price movements. Technical analysis depends on charts and statistical indicators. analysts use various techniques, such as trend analysis, chart patterns, and technical indicators like moving averages or relative strength index (RSI), to identify potential buying or selling opportunities for Astral Limited.
The main goal of technical analysis of Astral Limited share price is to predict future price movements based on historical data and market psychology, helping investors make informed decisions about when to enter or exit trades. So, bellow we are explaining Various techniques as of 10th May 2024 for technical analysis of Astral Limited.
Price Action
Price action and price level of Astral Limited (As of 10th May 2024) | |||
Price action | Daily Timeframe | Weekly Timeframe | Monthly Timeframe |
Candlestick | Strong Bullish Candlestick | Strong Bullish Candlestick | Continuous Bullish Candlestick |
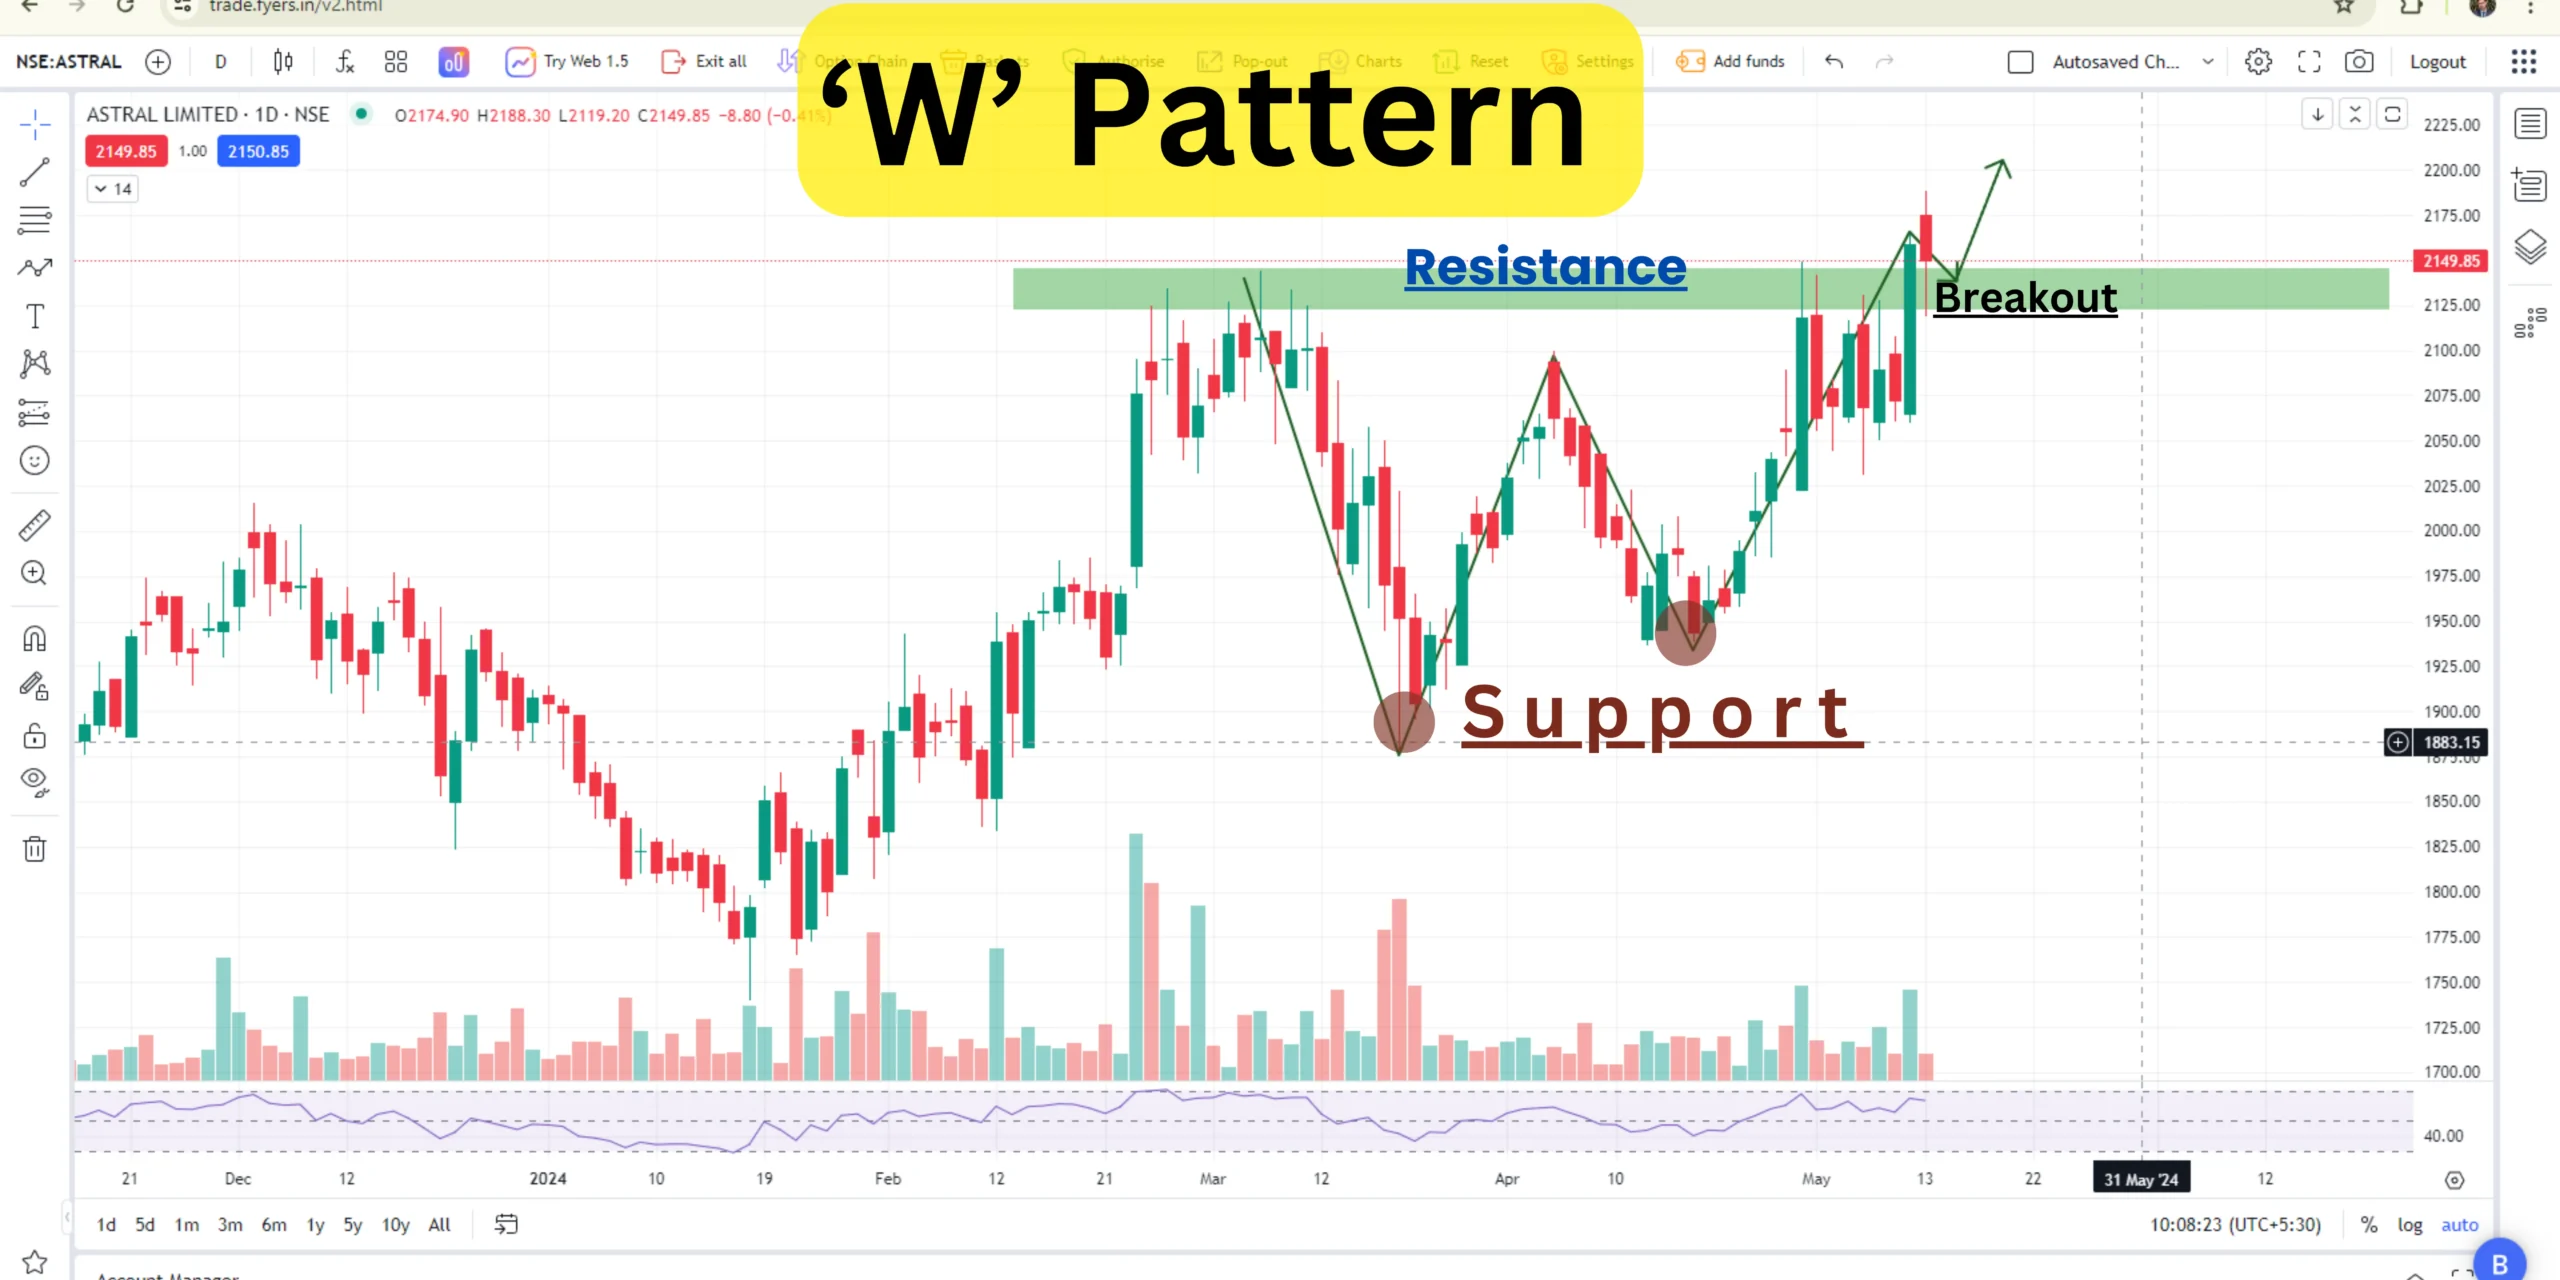
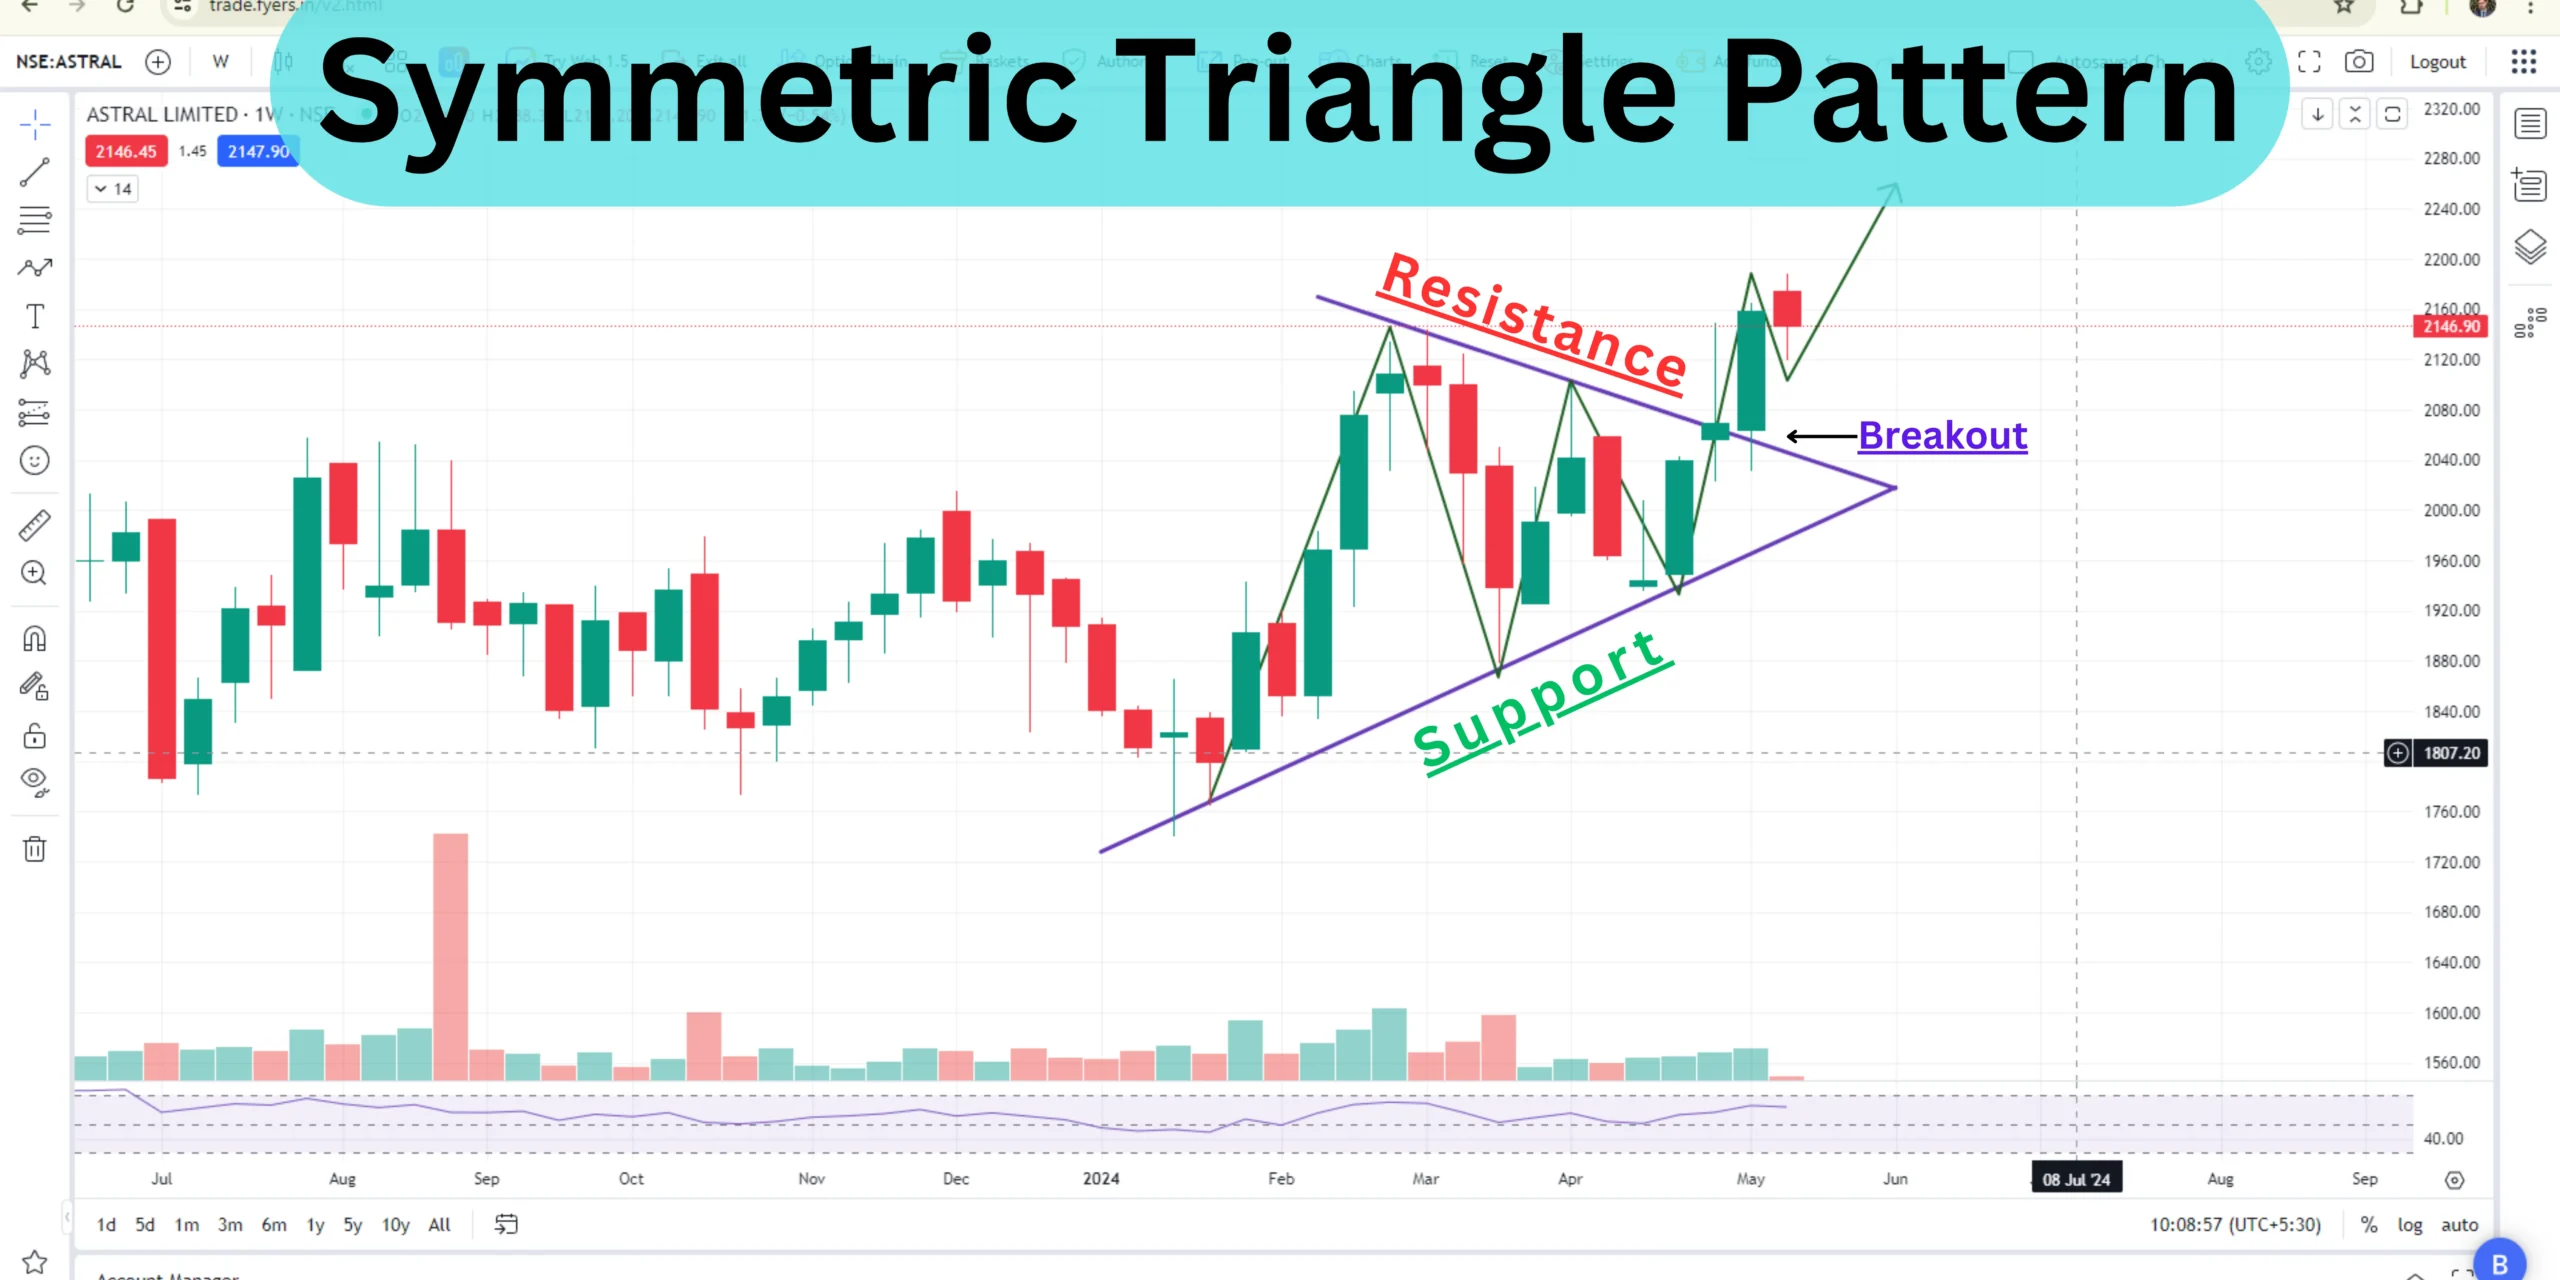
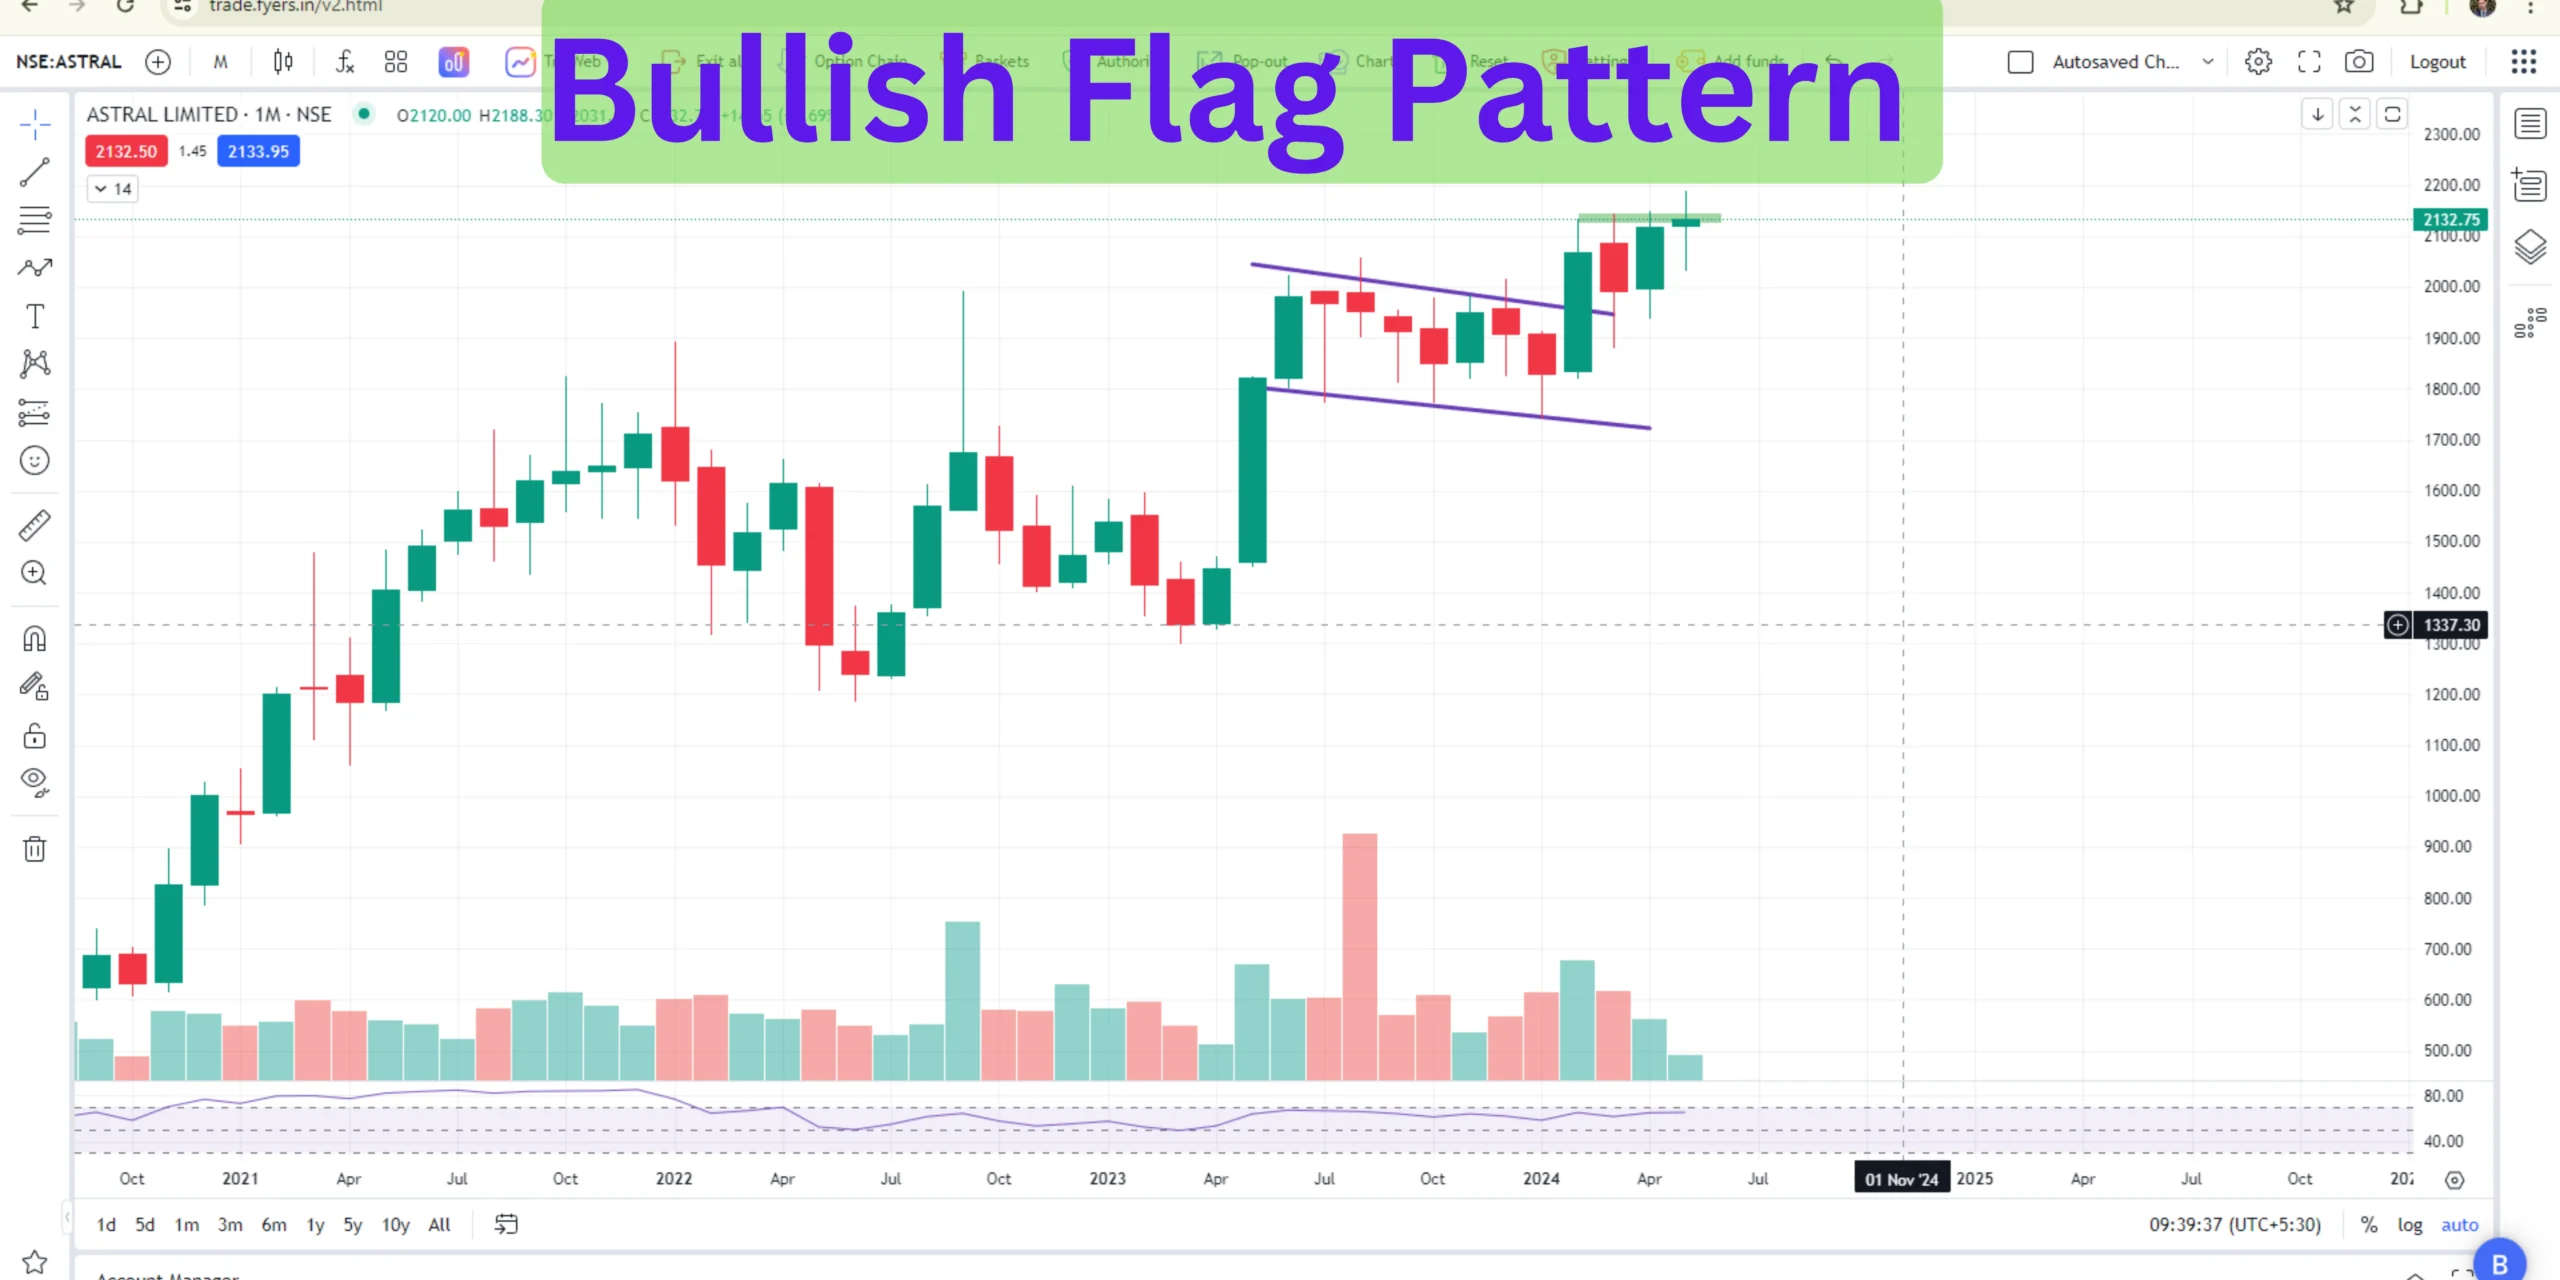
Chart Pattern | Double Bottom or ‘W’ Pattern | Symmetrical triangle pattern | Bullish Flage Pattern |
Price Support Level | 2050-2075 | 1930-1950 | 1800-1850 |
Price Level | 2158.65 is Current price | 52 weeks High 2164.90 | 52 weeks low 1529.85 |
As of 10th May 2024, Astral Limited exhibits compelling price action across different timeframes, accompanied by significant price levels and chart patterns, offering valuable insights for investors and traders.

Daily Timeframe:
On the daily timeframe, Astral Limited displays a Strong Bullish Candlestick pattern with sufficient volume. This indicates a robust bullish sentiment in the stock, supported by the breakout of the price range between 1775-2130. The stock has strongly breached resistance levels and reached an all-time high, reflecting strong buying momentum. This breakout suggests a potential continuation of the upward trend, with traders likely to capitalize on the bullish momentum.
Additionally, the activation of a Double Bottom or ‘W’ Pattern, along with a long-range breakout and neckline breakout, further reinforces the bullish outlook. The price support level for Astral Limited on the daily timeframe is identified between 2050-2075, indicating a region where buying interest may intensify, providing additional support to the stock’s price.

Weekly Timeframe:
On the weekly timeframe, Astral Limited continues to exhibit a Strong Bullish Candlestick pattern with high volume, indicating sustained strength in the stock’s upward movement. The stock has closed at an all-time high, making a new 52-week high, reflecting significant bullish sentiment among investors. This strong upward momentum is further supported by the activation of a Symmetrical Triangle pattern, with the stock sustaining above the breakout level.
The Symmetrical Triangle pattern suggests a period of consolidation followed by a potential continuation of the uptrend, providing traders with a clear indication of market direction. The price support level for Astral Limited on the weekly timeframe is observed between 1930-1950, indicating a level where buying pressure may emerge, bolstering the stock’s price.

Monthly Timeframe:
On the monthly timeframe, Astral Limited demonstrates a Continuous Bullish Candlestick pattern, indicating a persistent bullish sentiment in the market. The stock is poised to form a higher high, suggesting a favourable outlook for future price movements. Additionally, the activation of a Bullish Flag pattern further reinforces the bullish sentiment, with the pattern indicating a brief pause in the uptrend before a potential continuation.
The Bullish Flag pattern suggests a strong bullish bias among traders, with the potential for further upside movement in the stock. The price support level for Astral Limited on the monthly timeframe is identified between 1800-1850, highlighting a zone where buyers are likely to step in, providing additional support to the stock’s price.
Price Levels:
The current price of Astral Limited stands at 2158.65, representing the same level as the 52-week high. This indicates a strong bullish sentiment and suggests the potential for further upside movement in the stock.
The 52-week high for Astral Limited is recorded at 2164.90, reflecting significant strength in the uptrend and indicating investor confidence in the company’s prospects.
Conversely, the 52-week low for Astral Limited is observed at 1529.85, serving as a reference point for the lowest price level reached by the stock in the past year.
In conclusion, Astral Limited demonstrates compelling price action and significant price levels across various timeframes, supported by bullish candlestick patterns and chart patterns. Investors and traders may consider this analysis alongside other fundamental and technical factors when making informed decisions regarding their investments in Astral Limited.
Indicators Use for Technical Analysis
Bolinger Band (BB):
Bolinger Band Price level in Astral Limited (As of 10th May 2024) | |||
| Upper Band | Median | Lower Band |
Bolinger Band | 2151.29 | 2030.54 | 1909.82 |
As of 10th May 2024, Astral Limited demonstrates significant price levels within the Bollinger Bands, offering insights into potential market movements.
The upper band of the Bollinger Bands is observed at 2151.29 for Astral Limited. The stock has closed above the upper band and is sustaining at this level, indicating a robust bullish rally. This suggests strong buying momentum and potential for further upside movement in the stock price.
The median of the Bollinger Bands stands at 2030.54 for Astral Limited. This level is showing strong support for the stock, indicating a point where buying interest is significant. Investors may view this level as a favourable entry point, with potential for the stock price to rebound from this support level.
Astral Limited’s lower band is identified at 1909.82 within the Bollinger Bands. This level is also showing strong support, particularly over a longer period. The lower band serves as a critical level where buyers may step in to support the stock price, preventing further downside movement.
Moving Average (MA):
Moving Average price level in daily candlestick of Astral Limited (As of 10th May 2024) | ||
Moving Average | 100 Day | 200 Day |
Simple Moving Average (SMA) | 1957.29 | 1938.90 |
Exponential Moving Average (EMA) | 1979.75 | 1914.30 |
As of 10th May 2024, Astral Limited exhibits notable moving average price levels in its daily candlestick chart, providing insights into potential support and resistance levels for investors.
Simple Moving Average (SMA):
The 100-day SMA stands at 1957.29 for Astral Limited. This level serves as a good support at the long term, indicating a point where buying interest is significant. Investors may view this level as a favourable entry point, with potential for the stock price to rebound from this support level.
The 200-day SMA is observed at 1938.90 for Astral Limited. Similar to the 100-day SMA, this level also provides good support at the long term. Investors may interpret this as a key level where buying interest is strong, potentially preventing further downside movement in the stock price.
Exponential Moving Average (EMA):
Astral Limited’s 100-day EMA is recorded at 1979.75. This level indicates good support at the long term, suggesting a point where buying interest is significant and potentially providing a floor for the stock price.
The 200-day EMA for Astral Limited stands at 1914.30. Similar to the 100-day EMA, this level also demonstrates good support at the long term. Investors may interpret this as a critical level where buying interest is strong, potentially serving as a key support level for the stock price.
Data Analysis
Open Interest Put Call Ratio of Astral Ltd
Open Interest Put Call Ratio of Astral Ltd | ||||
Expiry Date | Put Open Interest | Call Open Interest | PCR OI | Signal |
30/05/2024 | 575.09 K | 1400.84 K | 0.411 | Bullish |
27/06/2024 | 0 | 8808.00 | 0.0345 | Strong Bullish |
Astral Ltd’s open interest put call ratio (PCR OI) indicates options trading sentiment. On the 30th of May 2024, with a PCR OI of 0.411, the market sentiment is bullish. Similarly, on the 27th of June 2024, the PCR OI is 0.0345, signalling a strong bullish sentiment. These ratios suggest an optimistic outlook among investors towards Astral Ltd’s stock, implying potential upward momentum in the near term.
Volume Put Call Ratio of Astral Ltd
Volume Put Call Ratio of Astral Ltd | ||||
Expiry Date | Put Total Contracts | Call Total Contracts | PCR Volume | Signal |
30/05/2024 | 1952.00 | 14963.00 | 0.130 | Strong Bullish |
27/06/2024 | 0.000 | 4.00 | 0.0370 | Strong Bullish |
Astral Ltd’s volume put call ratio (PCR Volume) offers insights into options trading sentiment. On the 30th of May 2024, with a PCR Volume of 0.130, indicating a strong bullish sentiment in the market. Similarly, on the 27th of June 2024, the PCR Volume registers at 0.0370, signaling a continuation of the strong bullish sentiment. These ratios suggest a prevailing optimism among investors towards Astral Ltd’s stock, implying potential upward momentum in the near term.
conclusion
In conclusion, based on the comprehensive analysis of Astral Limited presented in this article, a strong recommendation is made for investing in this stock. Astral Limited has demonstrated stable profitability, healthy liquidity and solvency, efficient operational management, attractive valuation metrics, and robust growth prospects over the years. The company’s fundamental analysis highlights its strong financial performance across various parameters, indicating its resilience and potential for long-term growth.
Moreover, the technical analysis reveals compelling price action, significant price levels, and bullish indicators across different timeframes, suggesting a favorable outlook for the stock. Additionally, the open interest put call ratio and volume put call ratio indicate optimistic sentiment among investors, further supporting the recommendation to invest in Astral Limited. Overall, Astral Limited emerges as a promising investment opportunity, poised for continued success and value creation for shareholders.
FAQs
- What is Astral Limited and what does it specialize in?
Astral Limited is a prominent Indian company specializing in building materials and equipment. It is known for manufacturing chlorinated polyvinyl chloride (CPVC) and polyvinyl chloride (PVC) pipes.
- When was Astral Limited founded, and who were its founders?
Astral Limited was founded in 1996 by Sandeep Engineer under the name Astral Poly Technik Limited.
- What are the main products offered by Astral Limited?
Astral Limited offers a wide range of products including CPVC and PVC pipes, adhesives, sealants, construction chemicals, and various plastic products.
- Where is Astral Limited headquartered, and where are its major operations located?
Astral Limited is headquartered in Ahmedabad, India. It has operations across the country and serves both domestic and international markets.
- Can you provide an overview of Astral Limited’s journey and key milestones?
Astral Limited has undergone significant growth since its inception, expanding its product offerings, entering new markets, and achieving milestones such as its public listing in 2007.
- What are the subsidiaries of Astral Limited, and what do they specialize in?
Astral Limited’s subsidiaries include Astral Adhesives, Seal It Services Limited, Rex Poly Extrusion Pvt Ltd, Astral Pipes, and Astral Biochem Private Limited, each specializing in different segments of the building materials industry.
- What is the shareholding pattern of Astral Limited?
The shareholding pattern of Astral Limited includes promoters, foreign institutional investors (FIIs), domestic institutional investors (DIIs), mutual funds, and retail investors.
- How does Astral Limited perform in terms of financial metrics such as profitability, liquidity, and solvency?
Astral Limited demonstrates stable profitability, healthy liquidity, conservative capital structure, and efficient operational management, as indicated by its financial ratios.
- What is the technical analysis of Astral Limited’s stock price and market performance?
Astral Limited’s technical analysis suggests bullish sentiment, supported by strong price action, chart patterns, and significant price levels across various timeframes.
- Based on the available information, what is the recommendation for investing in Astral Limited?
The recommendation for investing in Astral Limited depends on individual investment objectives, risk tolerance, and market conditions. It is advisable to conduct thorough research and seek professional advice before making investment decisions.

